Chapter 6
Advanced protein features
Page 6-12
MAN 0487
SLS Debye plot
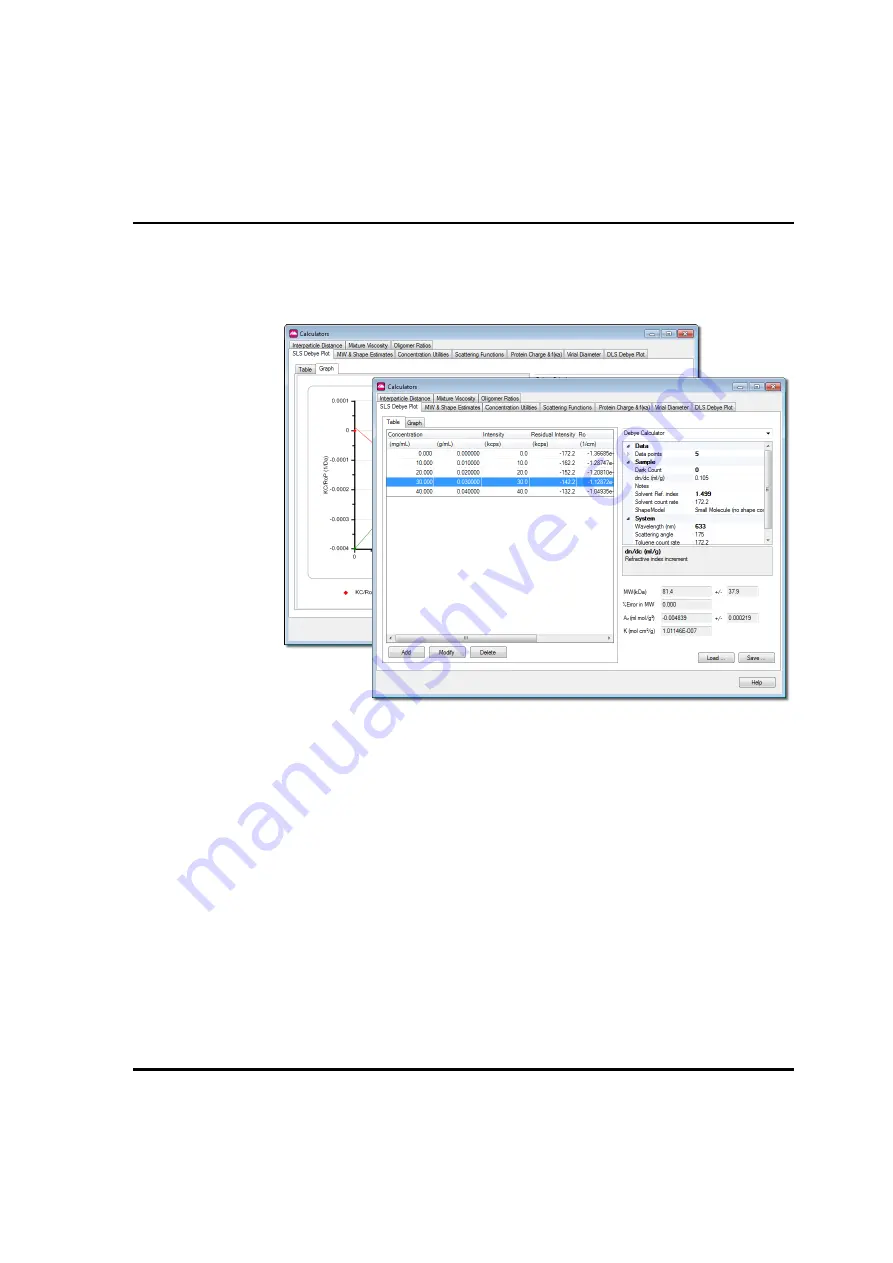
As mentioned in the introduction, the
Calculators
tool includes the ability to
generate a Debye plot, using inputted rather than measured data.
This feature can be useful for various reasons, for example:
By combining individual measurements, one single Debye plot can be
generated.
A Debye plot can be created by entering the concentration points from an
existing measurement, then adding additional concentration points.
Any of the parameters in the window box can be changed; the other parameters
will be instantly recalculated. This can be used to investigate the sensitivity of
the result to changes in any parameter.
For example, by first entering the concentration points from an existing meas-
urement, a sample parameter - e.g. sample temperature - can be altered and the
effect immediately observed on the Debye plot. This saves time in performing
the original measurement again at the different temperature.
The format of the plot can be altered by changing the drop-down menu in the top
right hand corner of the window to
Chart properties
. The individual properties
can then be altered in the table below.


