17
Quickstart Guide
NANOCOLOR
®
UV
/
VIS
II /
VIS
II V 2.00/09‑2022
Step 5: Enter sample information
The icons for entering sample information are below the measurement result. The following
information is configured as a factory preset: comment, sample site, and dilution.
UV/VIS II
Open Mode, 01.03.2016, 10:57
23,1 mg/L P
436 nm
809 mg/L O
2
0.496 E
IQK
14 mm
Messen
Null
Probenehmer Probeort Kommentar
Eigenschaften
0,0 NTU
0791 Phosphat 50
Kommentar
Probeort Verdünnung (1+X) Anwender
Probenummer Datum & Zeit
Probetyp
Probenehmer
LOT
10
Sept
?
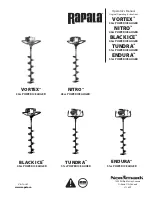
Fig. 16: Sample information
This selection can be changed and the sample
information can be entered using the
+
icon. Using the “Properties” command, new
sample information can be added under the
measurement menu (Fig. 16). To do this, the
desired icon in the dialogue box that opens
must be held down and dragged using a swiping
motion into the sample information line that is
illuminated in blue. To remove the icon from the
sample information bar, hold it down, drag it out
of the illuminated, blue sample information line
using a swiping motion and release it.
The information entered is stored together with
the measurement result.
Step 6: View results memory and IQC memory
The measured value memory can store up to 5000 measurement data and 100 scans or color
measurements. The measured value memory backs up the measurement results of the cuvette
tests, color measurements, and scans. In addition to the measurement result, all sample
information entered is also stored. During the storage process, the sample information is linked
in a tamper‑proof manner (GLP‑compliant) with the measurement result.
UV/VIS II
Open Mode, 01.03.2016, 10:57
<<
>>
1-18 (18)
Speicherplatz
17-09-2014, 10:27 044 Härte Ca / Mg
> 20 °d [23.0]
17-09-2014, 10:25 044 Härte Ca / Mg
> 50 mg/L Mg [92]
17-09-2014, 10:25 044 Härte Ca / Mg
50 mg/L Ca
17-09-2014, 10:25 044 Härte Ca / Mg
> 20 °d [34.2]
17-09-2014, 10:23 029 CSB 1500
327 mg/L O
2
16-09-2014, 10:25 029 CSB 1500
287 mg/L O
2
Typ der Messung
Probenummer
Anfangsdatum
Enddatum
Methode
Benutzer
Probeort
Probeart
Probenehmer
Anwender
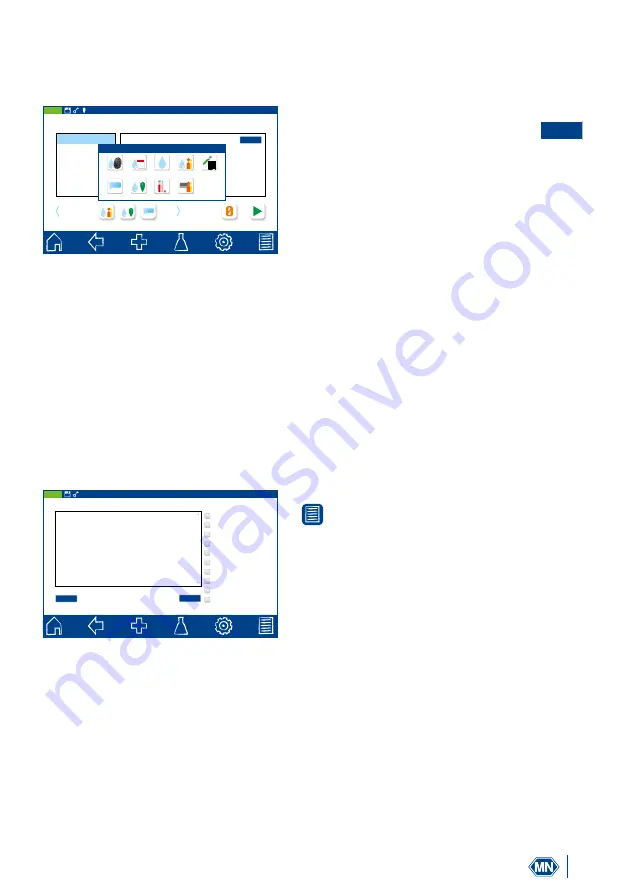
Fig. 17: Measured value memory
The measurement results are accessed using the
icon in the task bar. All measurement results
are displayed in a list, sorted by date.
There is the option to print the results, to export them as csv. files or .png files, or to select them.
In the memory menu, a selection can be made according to various sample information and
also according to the measurement method. After the data have been selected, they can also
be printed out or exported. When printing multiple measurement results, the printout contains
only the most important information of the respective measurement (date, time, method, result).
Detailed information of a measurement can be obtained by selecting an individual measurement
result in the memory. In addition to the result, all sample information entered here is shown.
The information received in this way can be printed or exported once again. In the case of