17
By clicking “Start” the
program will start plotting Current vs. Time. If logging is enabled,
these values will be logged in the logfile. Graph space can be cleared at any time without
losing the data on the logfile by clicking “Clear”. By clicking “St
op
,” the
power meter will
stop graphing. Clicking start again will resume graphing at the time it is clicked.
Based on the current measured by the Photodiode and the wavelength set by the user,
the software will calculate and plot the optical power or current based on the selected
parameter. To see the responsivity curve used to convert photodiode current to optical
power,
click on “Resp. Curve”
.
Users can set the wavelength by clicking the “Change”
button beside the wavelength value box
, then clicking “Save”.
To see the current output
(in mA
) select “Current” in the dropdown menu. (Current will be shown by
default.)
To see the Power output, select “Power” from the dropdown menu. Power may be
viewed in terms of mW or dBm. To view the graph in the desired unit, click the relevant
button in the top right of the Power Meter section to toggle between mW and dBm.
Using the mouse scroller, users can zoom in and out as well as click and drag to select
an area to view. Pressing the right button of the mouse and moving the mouse pointer
will allow the user to move the displayed area in vertical and horizontal axis. Zoom can
be reset by clicking the “Reset Zoom” button.
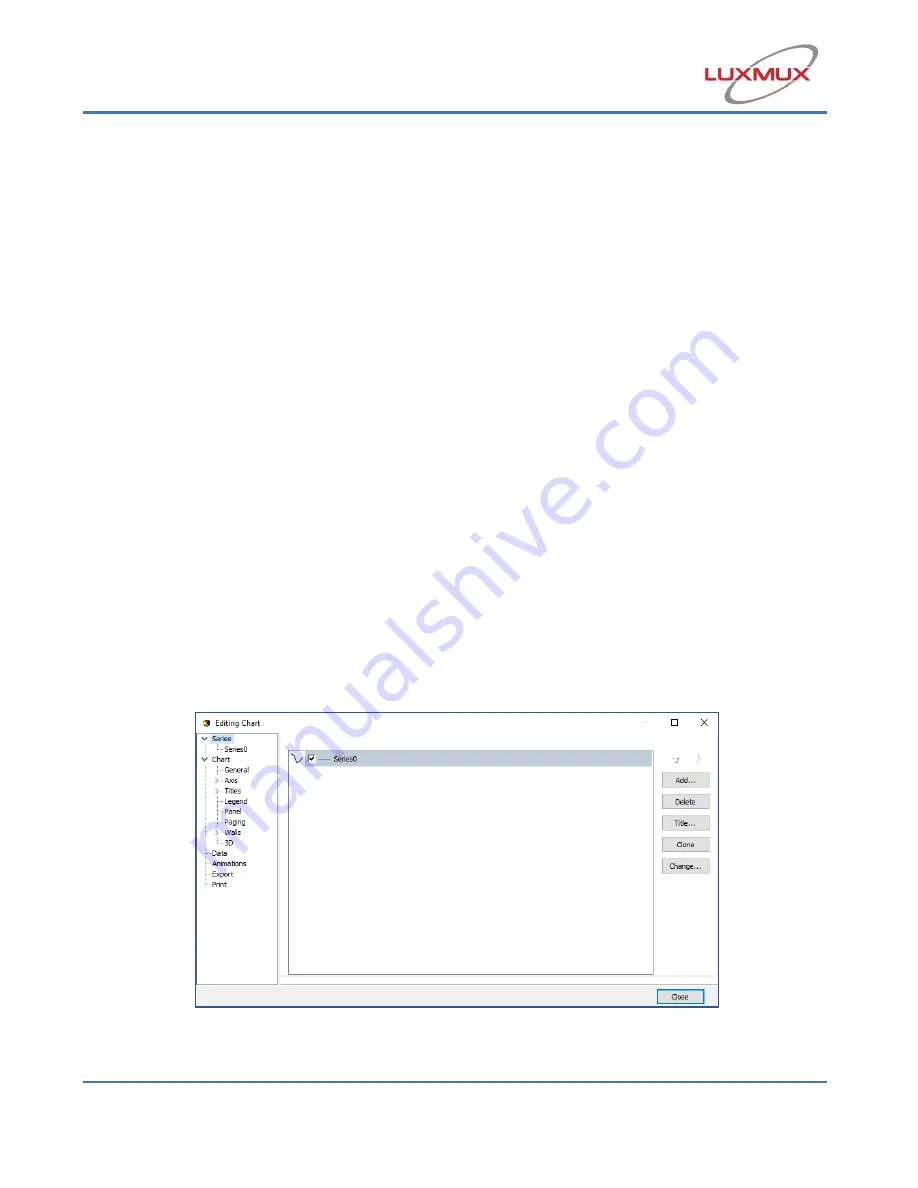
By clic
king the “Chart Options” button, the window
as shown in Figure 12 will appear
with further graph settings like axis, titles, legend, etc.
as well as an “Export Graph”
option.
Figure 12: Chart Options Window
Summary of Contents for BeST-SLED ISB2
Page 37: ...37 12 Ordering Code 12 1 Standard BeST SLED models...
Page 38: ...38...


