


82
3. The Sensitivity Control Bar appears. Press
↓
↑
to adjust sensitivity.
When it's set at the desired level, press
EXIT
.
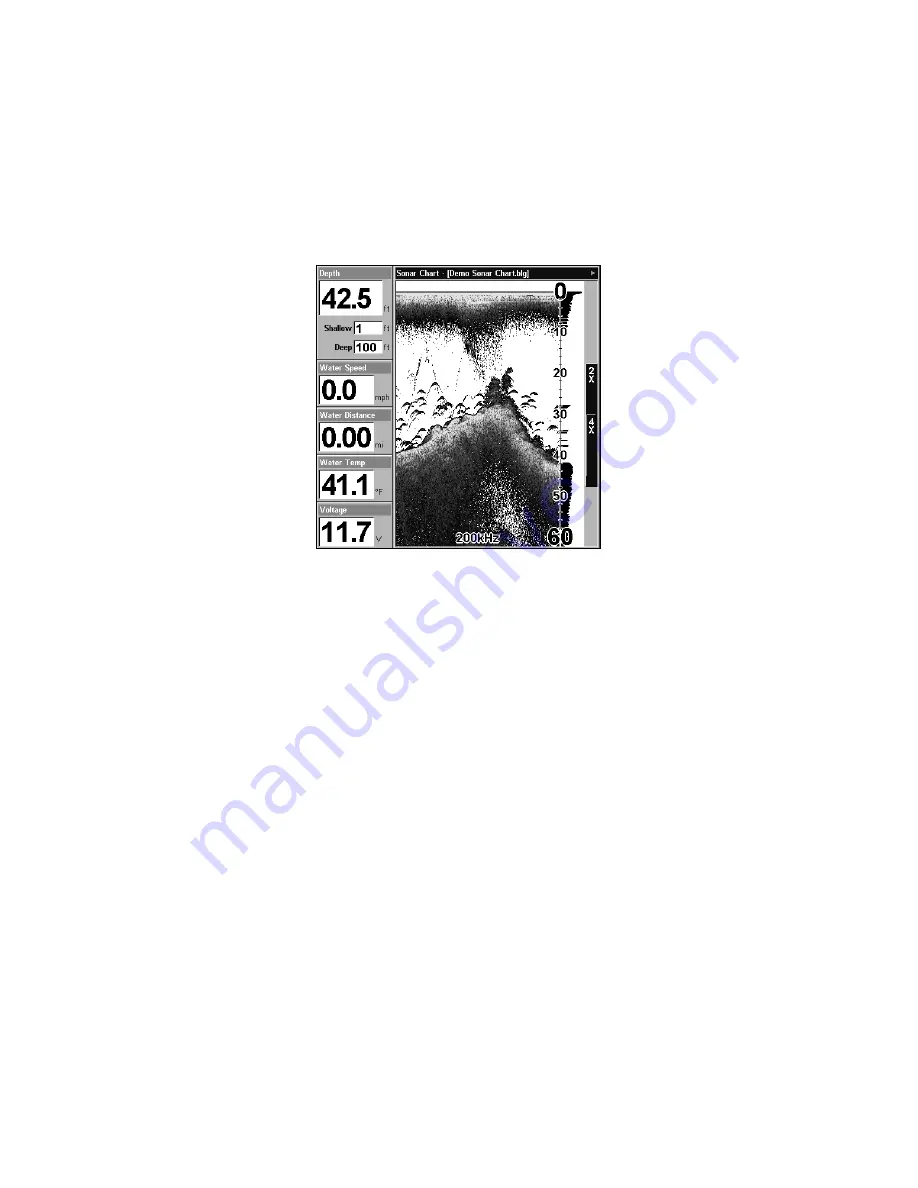
Digital Data/Chart
This mode shows the chart on the right side of the screen. The left side has
five digital data boxes containing: Water Depth; Water Speed (from an op-
tional speed sensor); Water Distance (distance traveled or log, it also re-
quires a speed sensor); Surface Water Temperature and Voltage.
Digital Data/Chart
Customize Page Displays
Every Page display option except Full Map (on the Map Page) has cus-
tomizable data boxes to provide constant on-screen information.
The data available from your unit is divided into categories in the Data
Viewer menu. These categories include GPS Data, Navigation, Trip
Calculator, Time, Sonar Data and Miscellaneous Data. You can select
items from any of these categories for display in any data box.
To change the information displayed in a data box:
On the Page display you want to change, press
MENU
|
↓
to
C
USTOM-
IZE
|
ENT
. A data box name flashes, indicating it is selected. Press
ENT
to
change the box or hit
↑
↓
,
←
→
to select another box, then press
ENT
.
You will see a list of categories with "+" or "–" symbols next to each of
them. A category with a "+" is closed, meaning its contents are hidden.
Summary of Contents for LMS-334c iGPS
Page 62: ...54 Notes ...
Page 98: ...90 Notes ...
Page 102: ...94 Notes ...
Page 134: ...126 Notes ...
Page 148: ...140 Notes ...
Page 182: ...174 Notes ...
Page 197: ...189 Notes ...