

31
Chemistry
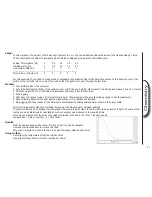
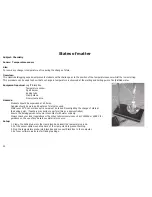
Method:
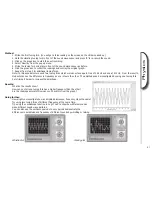
1. Fill the boiling tube with fi nely crushed ice.
2. Make sure the temperature probe does not touch the bottom or sides of the tube.
3. When the temperature reaches freezing, start logging.
4. Light the spirit burner.
5. When the temperature reaches 100
O
C, keep logging for a minute and then stop logging. (If it is not required that the
temperature reaches boiling point for reasons of safety, the readings can be stopped before this point is reached.)
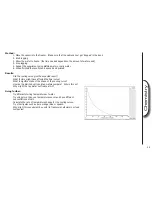
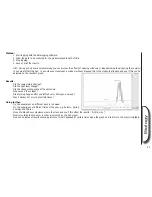
Hint: The real trick with getting a good change of state graph is to make sure that the temperature sensor remains in the melting ice
and does not touch the sides. If the sensor is moved too much, then strange results can occur due to convection effects in the tube.
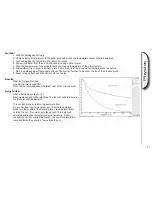
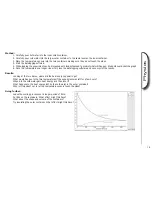
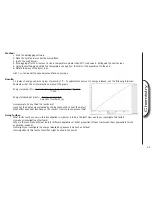
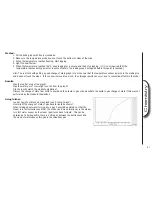
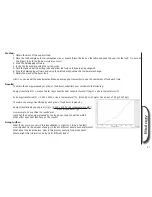
Results:
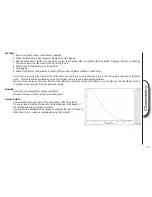
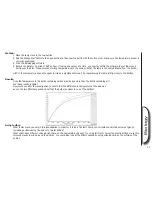
Was there a fl at area of the graph?
Was the water pure? How might you tell from the graph?
Did the results match the students prediction?
Discuss the change of state from Solid to liquid and then liquid to gas or demonstrate the liquid to gas change of state if this was not
performed by the students themselves.
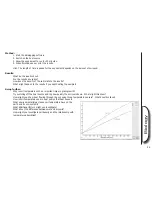
Going further:
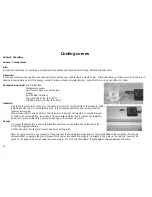
Look at how the state can be reversed (see ‘Cooling Curves’).
How might the change of state of gas back to liquid be shown?
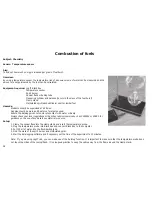
When talking about water turning into a gas it should be pointed out that the
steam is in fact colourless and that the ‘white cloud’ we normally say is the steam,
is in fact water vapour as the steam (gas) turns back to liquid. This can be
observed at a boiling kettle, there is a little gap between the kettle spout and
the cloud of water vapour, this gap is the colourless gas.


