Page
53 of 65
Histogram Window
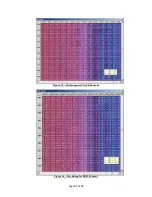
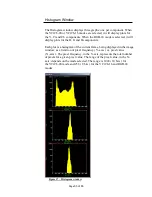
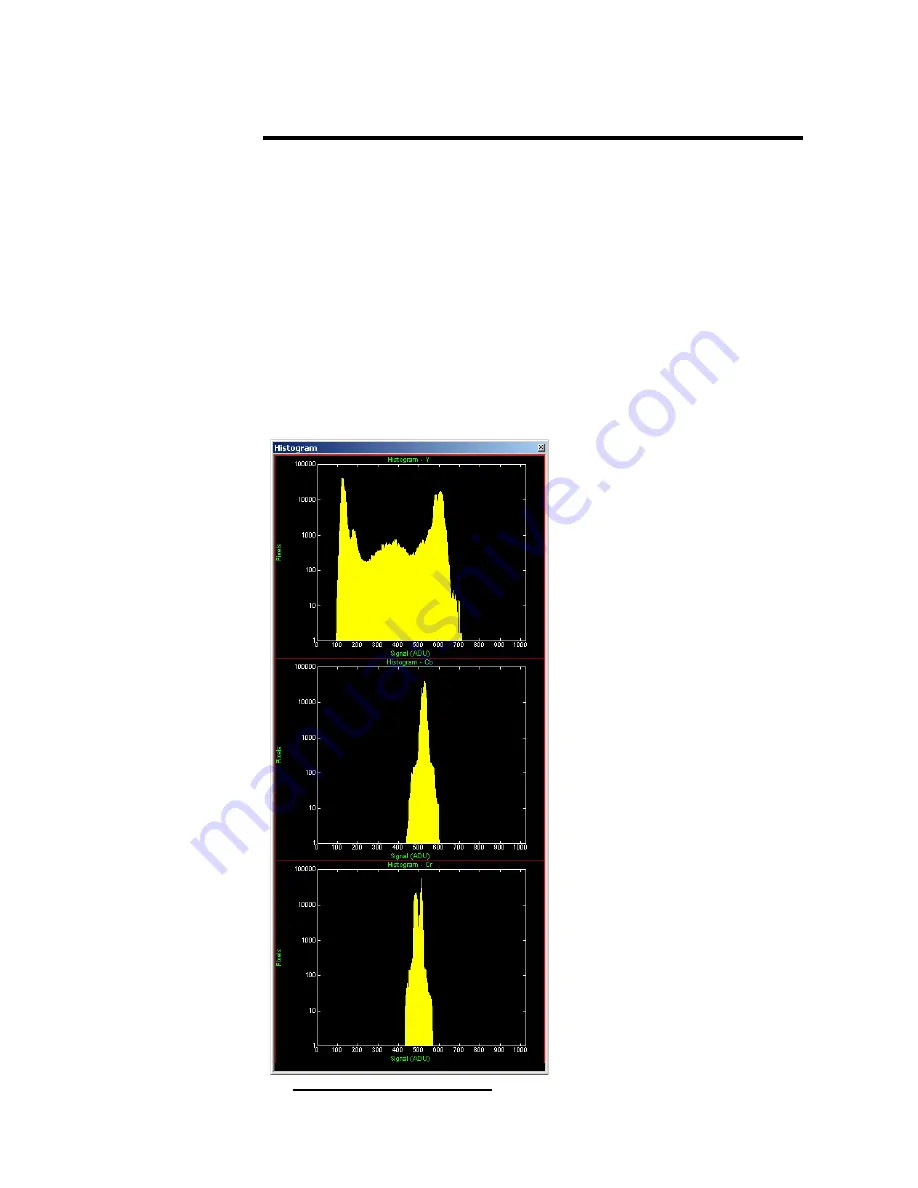
The Histogram window displays three graphs: one per component. When
the YCrCb-20 or YCrCb-16 modes are selected, it will display plots for
the Y, Cr and Cb components. When the RGB-24 mode is selected, it will
display plots for the R, G and B components.
Each plot is a histogram of the current frame, being displayed in the image
window, as a function of pixel frequency ( Y-axis ) vs. pixel value
( X-axis ). The pixel frequency, in the Y-axis, represents the total number
of pixels for a given pixel value. The range of the pixel value, in the X-
axis, depends on the mode selected. The range is 1024 ( 10 bits ) for
the YCrCb-20 mode and 256 ( 8 bits ) for the YCrCb-16 and RGB-24
modes.
Figure 17 – Histogram window

