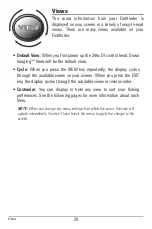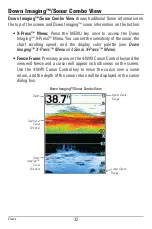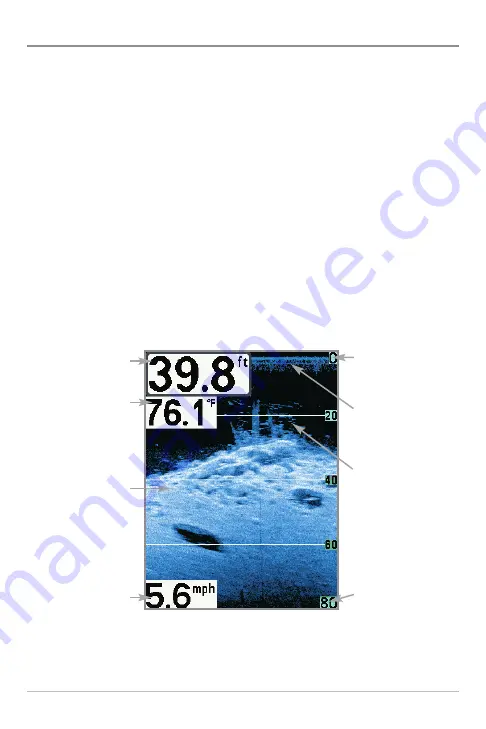
Down Imaging™ View
Down Imaging™ View
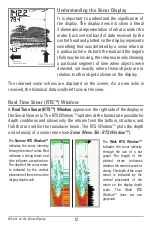
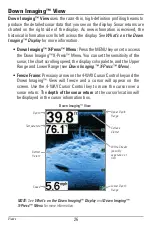
uses the razor-thin, high-definition profiling beams to
produce the detailed sonar data that you see on the display. Sonar returns are
charted on the right side of the display. As new information is received, the
historical information scrolls left across the display. See
What’s on the Down
Imaging™ Display
for more information.
•
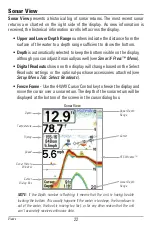
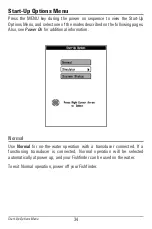
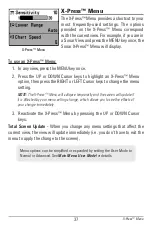
Down Imaging™ X-Press™ Menu:
Press the MENU key once to access
the Down Imaging™ X-Press™ Menu. You can set the sensitivity of the
sonar, the chart scrolling speed, the display color palette, and the Upper
Range and Lower Range (see
Down Imaging™ X-Press™ Menu
).
•
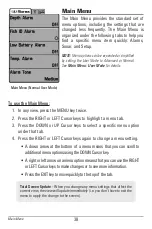
Freeze Frame:
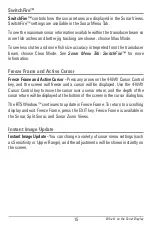
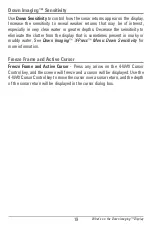
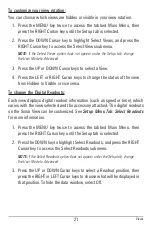
Press any arrow on the 4-WAY Cursor Control key and the
Down Imaging™ View will freeze and a cursor will appear on the
screen. Use the 4-WAY Cursor Control key to move the cursor over a
sonar return. The
depth of the sonar return
at the cursor location will
be displayed in the cursor information box.
NOTE:
See
What’s on the Down Imaging™ Display
and
Down Imaging™
X-Press™ Menu
for more information.
Down Imaging
™
View
White Streaks
(possibly
vegetation or
fish)
Lower Depth
Range
Surface
Clutter
Bottom
Return
Temperature
Speed
Depth
Upper Depth
Range
Views
26

