background image

14

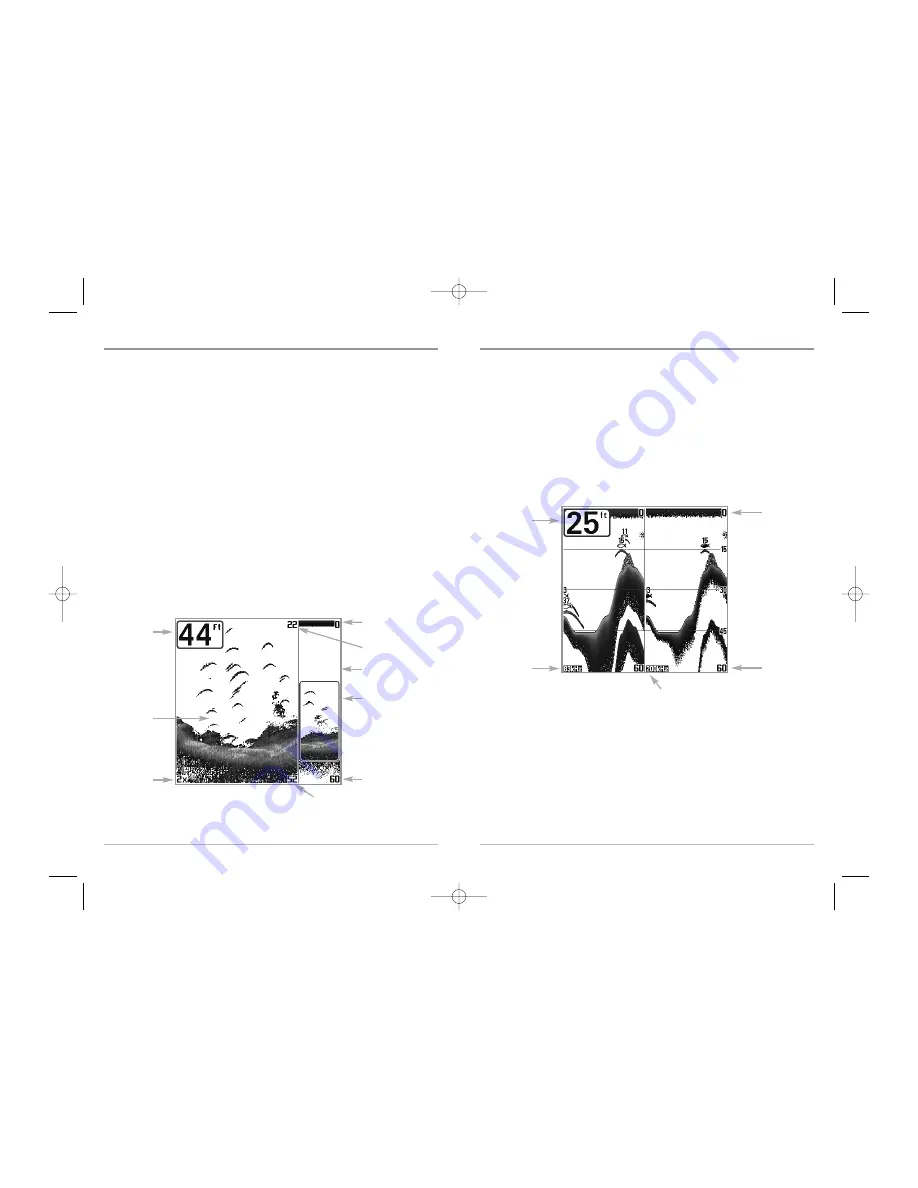
200/83 kHz Split Sonar View 

Split Sonar View 

displays sonar returns from the 83 kHz wide beam on the left side

of the screen and displays sonar returns from the 200 kHz narrow beam on the right
side of the screen.  Depth is always displayed in the upper left hand corner.  You can
use the Split Sonar View to make side by side comparisons between the sonar
returns from the 83 kHz wide beam and the 200 kHz narrow beam.

The digital readouts in the Split Sonar View cannot be customized; therefore,
information such as water temperature and voltage are unavailable in the Split
Sonar View.

200/83 kHz Split Sonar View

Depth

83 kHz 

Sonar History

Window

200 kHz 
Sonar History Window

Upper 
Depth Range

Lower 
Depth Range

13

Sonar Zoom View

Sonar Zoom View

increases the displayed resolution to separate sonar returns that

are very close together, such as those caused by fish suspended close to the bottom
or within structure. In Zoom View, the display is split to show a narrow slice of the
full range view on the right and the zoomed view on the left. The full range view on
the right also contains the Zoom Preview Box that shows what part of the full range
view is shown in zoom view on the left; the Zoom Preview Box tracks the bottom in
the full range view. 

As the depth changes, the zoomed view updates automatically to display a
magnified image of the bottom. The Zoom Preview Box shows where the zoomed
view is in relation to the full range view. The Zoom Level, or magnification, is
displayed in the lower left corner and can be changed to suit conditions (see 

Sonar

X-Press

TM

Menu: Zoom Level

). Upper and Lower Zoom Depth Range numbers indicate

the depth of the water which is being viewed.

Digital depth is displayed in the upper left hand corner.  The digital readouts in the
Sonar Zoom View cannot be customized; therefore, information such as water
temperature and voltage are unavailable in the Sonar Zoom View.

Sonar Zoom View 

Full Range View

Upper Depth Range, 
Full Range View

Lower Depth 
Range, Zoom View

Lower Depth Range, 
Full Range View

Zoomed

View

Zoom 
Preview Box

Zoom Level

Depth

Upper Depth Range, 
Zoom View

531447-1_A_343c_Eng.qxd  11/11/2005  9:18 PM  Page 18

www.Busse-Yachtshop.de      email: [email protected]

Summary of Contents for 343C

Page 1: ...343c Operations Manual 531447 1_A 343c Operations Manual 531447 1_A_343c_Eng qxd 11 11 2005 9 18 PM Page 1 www Busse Yachtshop de email info busse yachtshop de...

Page 2: ...o repair the original equipment or accessories by unauthorized individuals will void the warranty Handling and or opening this unit may result in exposure to lead in the form of solder WARNING This pr...

Page 3: ...1 Table of Contents iii Troubleshooting 52 300 Series Doesn t Power Up 52 300 Series Defaults to Simulator with a Transducer Attached 52 Display Problems 53 Finding the Cause of Noise 54 Specification...

Page 4: ...onar utilizes precision sound pulses or pings which are emitted into the water in a teardrop shaped beam The sound pulses echo back from objects in the water such as the bottom fish and other submerge...

Page 5: ...nar has a narrowly focused 20 center beam surrounded by a second beam of 60 expanding your coverage to an area equal to your depth In 20 feet of water the wider beam covers an area 20 feet wide The 20...

Page 6: ...anddifferenttimesoftheyear Athermocline typically appears as a continuous band of many colors moving across the display at the same depth 83kHzBlueFishSymbol BaitBall Fish the FishFinder displays fis...

Page 7: ...lay to the left A Digital Depth Readout is displayed in the upper left corner A scale with Upper and Lower Depth Range readouts appears along the right edge of the Sonar View The scale indicates the d...

Page 8: ...sonar intensity throughtheuseofcolors Red indicates a strong return and blue indicates a weak return Thedepthofthesonarreturn is indicated by the vertical placement of the return on thedisplaydepthsca...

Page 9: ...ay A Hard Bottom such as compacted sediment or flat rock appears as a thinner line across the display A Soft Bottom such as mud or sand appears as a thicker line across the display Rocky Bottoms have...

Page 10: ...right and the zoomed view on the left The full range view on the right also contains the Zoom Preview Box that shows what part of the full range view is shown in zoom view on the left the Zoom Previe...

Page 11: ...l be saved VIEW Key The VIEW key is used to cycle through all available views Press the VIEW key to advance to the next view Repeatedly pressing VIEW cycles through all views available Views can be hi...

Page 12: ...emporarily and the screen will update if it is affected by your menu setting change allowing you to see the effects of your action immediately Reactivate the X PressTM Menu by using the UP or DOWN Cur...

Page 13: ...a specific menu item quickly Alarms Sonar and Setup PresstheMENUkeytwicefortheMainMenu thenusethe 4 WAYCursorLEFTorRIGHTkeytoselectatab andusethe DOWN or UP key to select a specific menu item under th...

Page 14: ...em can be used on the water Exit Normal operation by powering your Fishing System off Start Up Options Menu 22 21 User Mode Normal or Advanced An Advanced Mode is provided for users who desire the hig...

Page 15: ...the water The Simulator is a very powerful tool that simulates on the water operation providing a randomly updated display We recommend going through this manual while using the Simulator since all o...

Page 16: ...frequencies as compared to specific sensitivity adjustments such as 83 kHz Sensitivity which allow you to adjust the level of sensitivity for one specific beam at a time To adjust the Sensitivity 1 Hi...

Page 17: ...u would see if the display went all the way to the bottom M 27 Upper Range Advanced Sonar SplitSonar BigDigitsandCircularFlasherViewsonly Upper Range sets the shallowest depth range that will be displ...

Page 18: ...rnational Models Only Default 15 feet 29 Chart Speed Chart Speed determines the speed at which the sonar information moves across the display and consequently the amount of detail shown A faster speed...

Page 19: ...e Split Sonar View will continue to display returns from both beams in their respective windows The RTS Window in the Sonar View will display the returns from the 200 kHz narrow beam When set to 83 kH...

Page 20: ...S Window Wide 33 Fish ID TM Fish ID TM uses advanced signal processing to interpret sonar returns and will display a Fish Symbol when very selective requirements are met When a fish is detected a fish...

Page 21: ...kHz Sensitivity menu choice is only available when User Mode is set to Advanced see Setup Menu Tab User Mode NOTE 83 kHz Sensitivity is particularly useful for adjusting the sensitivity of the 83 kHz...

Page 22: ...Auto the Fishing System will acquire bottom readings as needed within the capacity of the unit If the bottom is deeper than the Max Depth setting the digital depth readout will flash indicating that...

Page 23: ...TE In salt water what would be considered a large fish might be 2 to 10 times bigger than a large fish in fresh water depending on the type of fish you are seeking The salt water setting allows for a...

Page 24: ...larmwillsound Similarly ifthewatertemperaturerisesfrom 56 degrees to 58 degrees the Temp Alarm will also sound To change the Temp Alarm setting 1 Highlight Temp Alarm on the Alarms main menu 2 Use the...

Page 25: ...arm Tone setting High Medium Low Default Medium Setup Menu Tab From any view press the MENU key twice to access the tabbed Main Menu System then press the RIGHT cursor key until the Setup tab is selec...

Page 26: ...epth selects the units of measure for all depth related readouts To change the Units Depth setting 1 Highlight Units Depth on the Setup menu 2 Use the LEFT or RIGHT 4 WAY Cursor Control keys to change...

Page 27: ...alog box will appear To reset the defaults press the RIGHT Cursor key once more To cancel Restore Defaults press the LEFT Cursor key Select Views Advanced SelectViewssetstheavailableviewstoeitherhidde...

Page 28: ...epth readout to indicate depth from the waterline or boat s keel Enter a positive vertical measurement from the transducer to the waterline to read the depth from the waterline Enter a negative vertic...

Page 29: ...tem it goes into Simulator mode automatically even though a transducer is already connected this means that the control head is not detecting the transducer Perform the following troubleshooting tasks...

Page 30: ...rolheadlosespowerat high speeds Whentheboatmovesathigher speeds the bottom disappears or suddenly weakens or the display contains gaps There are no fish detected even when you know they are in the wat...

Page 31: ...ig Digits View is a Humminbird feature that displays the sonar graph and enlarged digital readouts for easy reading from a distance This is a great tool when monitoring the digital depth is important...

Page 32: ...appears on the display when any object moves through the sonar cone The arch results from a gradual decrease in distance to an object as it moves into the sonar cone The distance to an object changes...

Page 33: ...fficult to eliminate Pixels Pixels are the picture elements or small square blocks that make up the image on the LCD Measured as a vertical by horizontal number i e 640V x 320H this key specification...

Page 34: ...und bursts transmitted underwater to determine the distance and other attributes of objects in the water Distance can be determined because the speed of sound in water is constant and the time for the...

Page 35: ...rming the sonar beam Internally the transducer consists of one or more piezo electric disks that expand by very minute amounts to create the sound wave This element also works in reverse converting th...

Page 36: ...that makes the most commonly used menu selections available with one press of the MENU key Items that appear on the X Press Menu are related to the current view and present the most logical choices fo...

Reviews: