Ymax,Ymin,Xmax,Xmin
- The X & Y scale for the Graph Window is based upon the minimum and
maximum values as shown by Ymax, Ymin, Xmax and Xmin respectively. To change the scale of
the graph, select the “Settings” button.
Settings Button
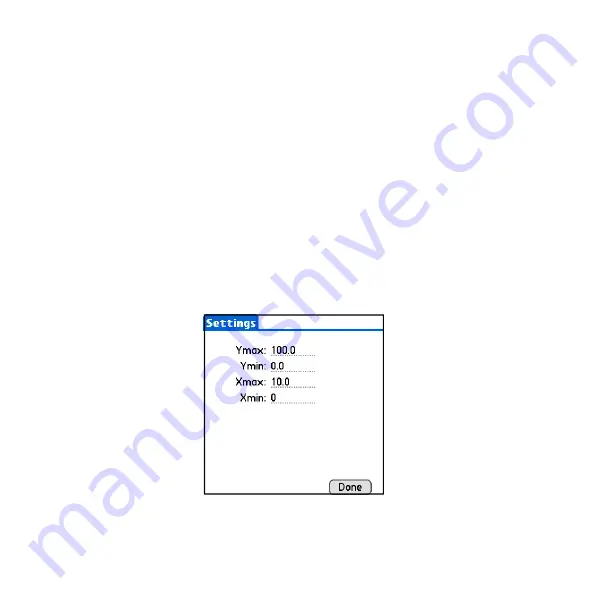
- This button opens the setting screen where the scale of the graph can be changed
(Figure 18). The values for the vertical scale (Ymax, Ymin) and the horizontal scale (Xmax, Xmin)
can be edited here simply by entering a new value into the corresponding fields. Once you have
entered the desired values, select “Done” to return to the graph screen. The graph will now reflect
the scale that was entered.
Start Button
- This button will start the graphing of the selected variables.
Stop Button
- This button will stop the graphing of the selected variables.
Done Button
- To stop the graphing and exit the graphing screen, select this button. The graphed
data will automatically be saved to the palm.
X Axis Scroll Buttons
- These two arrow shaped buttons will scroll the X axis in the corresponding
direction. This is useful for graphs which have a large amount of trending data.
Figure 18 - Settings Screen
Page 19


