


10
Subject to change without notice
When investigating pulse or square waveforms, the critical
feature is the
risetime of the voltage step
. To ensure that
transients, ramp-offs, and bandwidth limits do not unduly influence
the measuring accuracy, the risetime is generally measured
between
10%
and
90%
of the vertical pulse height. For
measurement adjust the Y attenuator switch with its variable
control together with the
Y-POS.
control so that the pulse height
is precisely aligned with the 0% and 100% lines of the internal
graticule. The 10% and 90% points of the signal will now coincide
with the 10% and 90% graticule lines.
The risetime is given by
the product of the horizontal distance in div. between these
two coincidence points and the time coefficient setting
. If X
x10 magnification is used, this product must be divided by 10. The
fall time
of a pulse can also be measured by using this method.
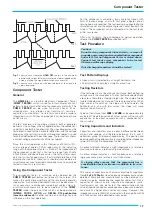
The following figure shows correct positioning of the oscilloscope
trace for accurate risetime measurement.
With a time coefficient of 0.2µs/div. and pushed X-MAG x10
button the example shown in the above figure results in a
measured total risetime of
t
tot
= 1.6div x 0.2µs/div. / 10 =
32ns
When very fast risetimes are being measured, the risetimes of
the oscilloscope amplifier and of the attenuator probe has to be
deducted from the measured time value. The risetime of the
signal can be calculated using the following formula.
In this t
tot
is the total measured risetime, t
osc
is the risetime of the
oscilloscope amplifier (approx. 10ns), and tp the risetime of the
probe (e.g. = 2ns). If t
tot
is greater than 100ns, then t
tot
can be
taken as the risetime of the pulse, and calculation is unnecessary.
Calculation of the example in the figure above results in a signal
risetime
t
r
=
√
32
2
- 10
2
- 2
2
=
30,3ns
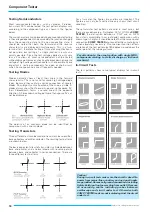
The measurement of the rise or fall time is not limited to the
trace dimensions shown in the above diagram. It is only
particularly simple in this way. In principle it is possible to
measure in any display position and at any signal amplitude. It
is only important that the full height of the signal edge of
interest is visible in its full length at not too great steepness and
that the horizontal distance at 10% and 90% of the amplitude
is measured. If the edge shows rounding or overshooting, the
100% should not be related to the peak values but to the mean
pulse heights. Breaks or peaks (glitches) next to the edge are
also not taken into account. With very severe transient
distortions, the rise and fall time measurement has little meaning.
For amplifiers with approximately constant group delay
(therefore good pulse transmission performance) the following
numerical relationship between rise time
tr
(
in ns
) and bandwidth
B
(
in MHz
) applies:
Connection of Test Signal
Caution:
When connecting unknown signals to the oscilloscope
input, always use automatic triggering and set the DC-AC
input coupling switch to AC. The attenuator switch should
initially be set to 20V/div.
Sometimes the trace will disappear after an input signal has
been applied. The attenuator switch must then be turned back
to the left, until the vertical signal height is only 3-8div. With
a signal amplitude greater than 160V
pp
, an attenuator probe
must be inserted before the vertical input. If, after applying
the signal, the trace is nearly blanked, the period of the signal
is probably substantially longer than the set value on the
TIME/DIV.
switch. It should be turned to the left to an
adequately larger time coefficient.
The signal to be displayed can be connected directly to the Y-
input of the oscilloscope with a shielded test cable such as HZ
32 or HZ 34, or reduced through a x10 or x100 attenuator
probe. The use of test cables with high impedance circuits is
only recommended for relatively low frequencies (up to approx.
50kHz). For higher frequencies, the signal source must be of
low impedance, i.e. matched to the characteristic resistance
of the cable (as a rule 50
Ω
). Especially when transmitting
square and pulse signals, a resistor equal to the characteristic
impedance of the cable must also be connected across the
cable directly at the Y-input of the oscilloscope. When using
a 50
Ω
cable such as the HZ 34, a 50
Ω
through termination type
HZ22 is available from
HAMEG
.
When transmitting square signals with short rise times, transient
phenomena on the edges and top of the signal may become
visible if the correct termination is not used. A terminating
resistance is sometimes recommended with sine signals as
well. Certain amplifiers, generators or their attenuators maintain
the nominal output voltage independent of frequency only if
their connection cable is terminated with the prescribed
resistance. Here it must be noted that the terminating resistor
HZ22 will only dissipate a maximum of 2 Watts. This power is
reached with 10 Vrms or at 28.3 V
pp
with sine signal.
If a x10 or x100 attenuator probe is used, no termination is
necessary. In this case, the connecting cable is matched
directly to the high impedance input of the oscilloscope. When
using attenuators probes, even high internal impedance sources
are only slightly loaded (approx. 10M
Ω
II 16pF or 100M
Ω
II 9pF
with HZ53). Therefore, if the voltage loss due to the attenuation
of the probe can be compensated by a higher amplitude setting,
the probe should always be used. The series impedance of the
probe provides a certain amount of protection for the input of
the vertical amplifier. Because of their separate manufacture,
all attenuator probes are only partially compensated, therefore
accurate compensation must be performed on the oscilloscope
(see ”Probe compensation” ).
Standard attenuator probes on the oscilloscope normally
reduce its bandwidth and increase the rise time. In all cases
where the oscilloscope bandwidth must be fully utilized (e.g.
for pulses with steep edges) we strongly advise using the
probes HZ51
(x10)
HZ52
(x10 HF) and
HZ54
(x1 and x10). This
can save the purchase of an oscilloscope with larger bandwidth
and has the advantage that defective components can be
ordered from
HAMEG
and replaced by oneself. The probes
mentioned have a HF-calibration in addition to low frequency
calibration adjustment. Thus a group delay correction to the
Type of signal voltage


