21
Diagnostic Readout – Advanced Functions
Saving Data
1.
If the Readout is active, click
Stop Polling Target
. The button changes to
Start Polling Target
.
2.
Check the
Save Readings every:
box and enter the save interval in milliseconds. This number must
be greater than or equal to the polling interval.
3.
Click
Start Polling Target
. The button changes to
Stop Polling Target
.
4.
You will be asked to specify a location to save the file and a file name. If the file is saved with an
.xls
extension, you will be able to import the data directly into Microsoft Excel
®
.
5.
Click
Stop Polling Target
to stop saving data.
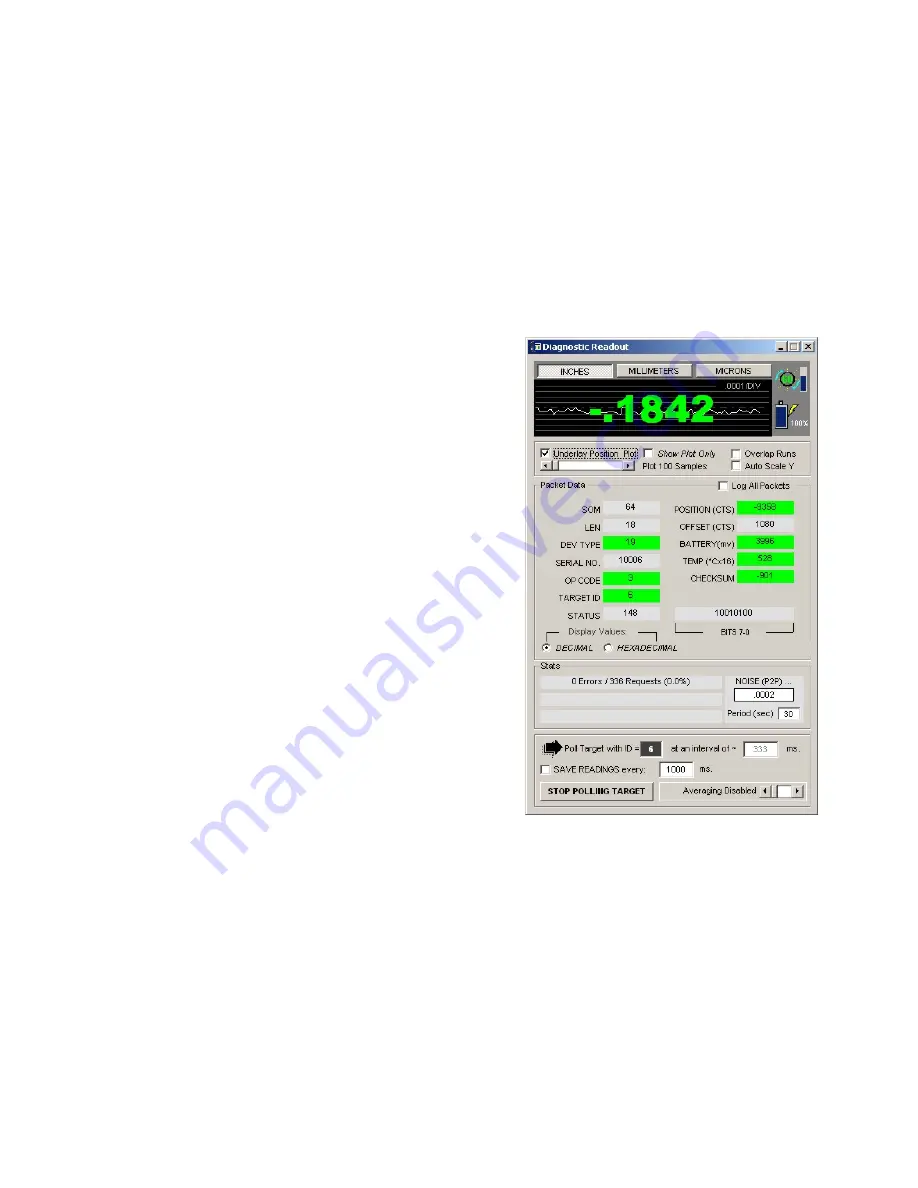
Dynamic Plot
Check
Underlay Position Plot
. The position readings will
plot behind the Numerical Position Display.
Plot Options:
•
Check
Show Plot Only
to hide the numerical position.
•
By default the plot will show 100 samples along the X-
axis. The slide bar below
Underlay Position Plot
allows you to change the number of samples to plot.
•
Check
Overlap Runs
to prevent the plot screen from
being cleared every time the maximum number of
samples is reached.
•
Double-click on the plot area to clear and re-center the
current position.
Figure 37 –
Data Plot


