User Manual
45
•
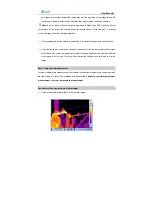
Multiple kinds of analysis can be performed on it, such as static temperature
measurement, spot analysis, area analysis, line analysis, isotherm analysis, visual image
replay, voice annotation replay, text annotation replay, histogram analysis, etc.
•
To do static temperature measurement and histogram analysis, please refer to the
sections Static temperature measurement and Histogram analysis respectively.
•
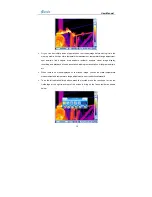
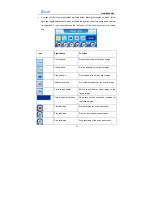
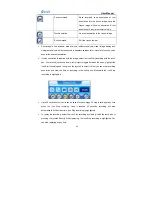
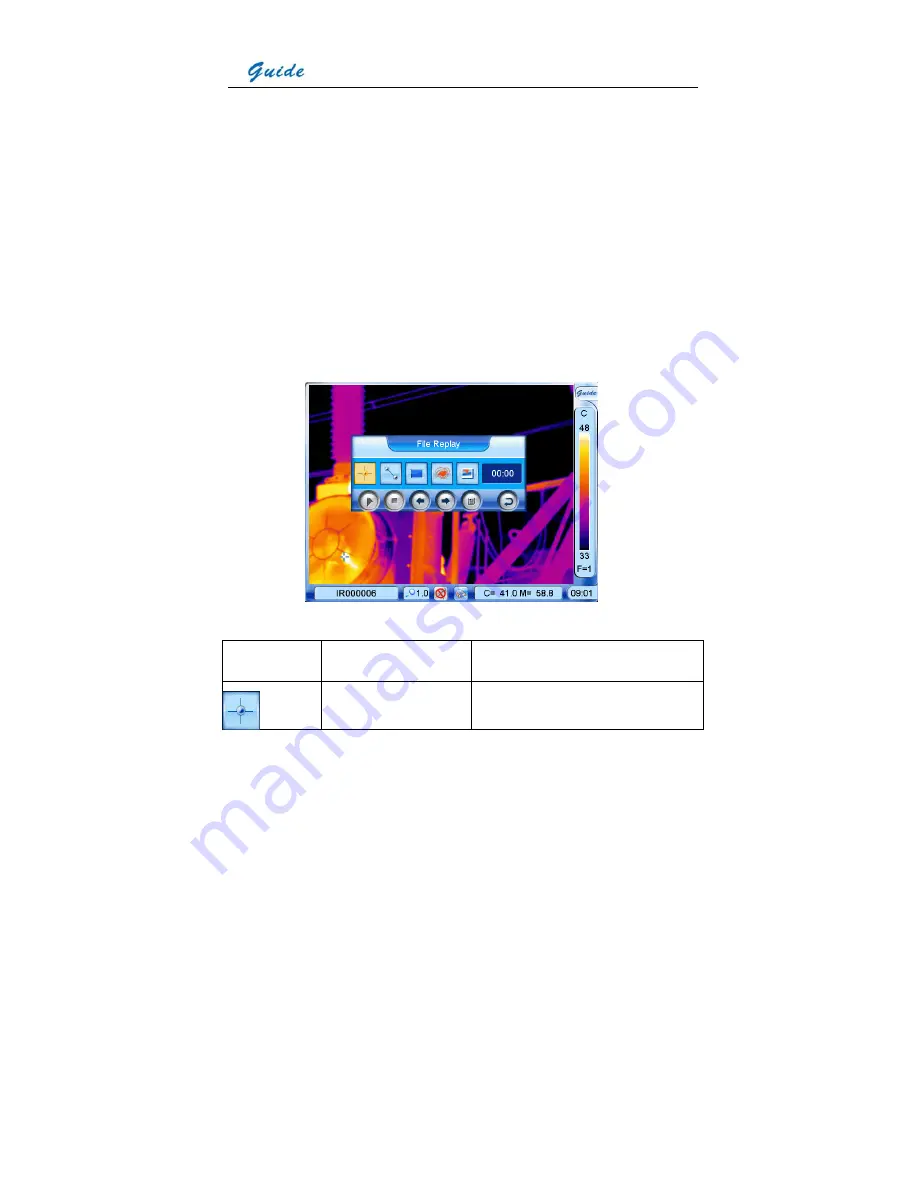
To do the left analysis listed above, bring up the replay toolbar by clicking icon Guide at
the right top corner of the screen with the touch pen or pressing the joystick. The toolbar
offers similar options to the frozen toolbar, whose functions are introduced below. Clicking
each icon with the touch pen can select them respectively. Or move the joystick up, down,
left or right to highlight one option first and press the joystick to select the highlighted
option.
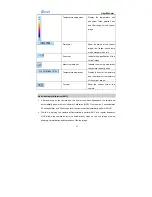
Icon Significance
Function
Spot analysis
Do spot analysis on the replayed image

