have an appropriate transducer or sensor connected to
the network.
1
Select
Info
>
Graphs
.
2
Select a graph.
Setting the Graph Range and Time Scales
You can indicate the amount of time and the range of
depth that appear in the depth and water temperature
graphs.
1
From a graph, select
Graph Setup
.
2
Select an option:
• To set a time-elapsed scale, select
Duration
. The
default setting is 10 minutes. Increasing the time-
elapsed scale allows you to view variations over a
longer period of time. Decreasing the time-elapsed
scale allows you to view more detail over a shorter
period of time.
• To set the graph scale, select
Scale
. Increasing the
scale allows you to view more variation in readings.
Decreasing the scale allows you to view more detail
in the variation.
Adjusting the Active Trim
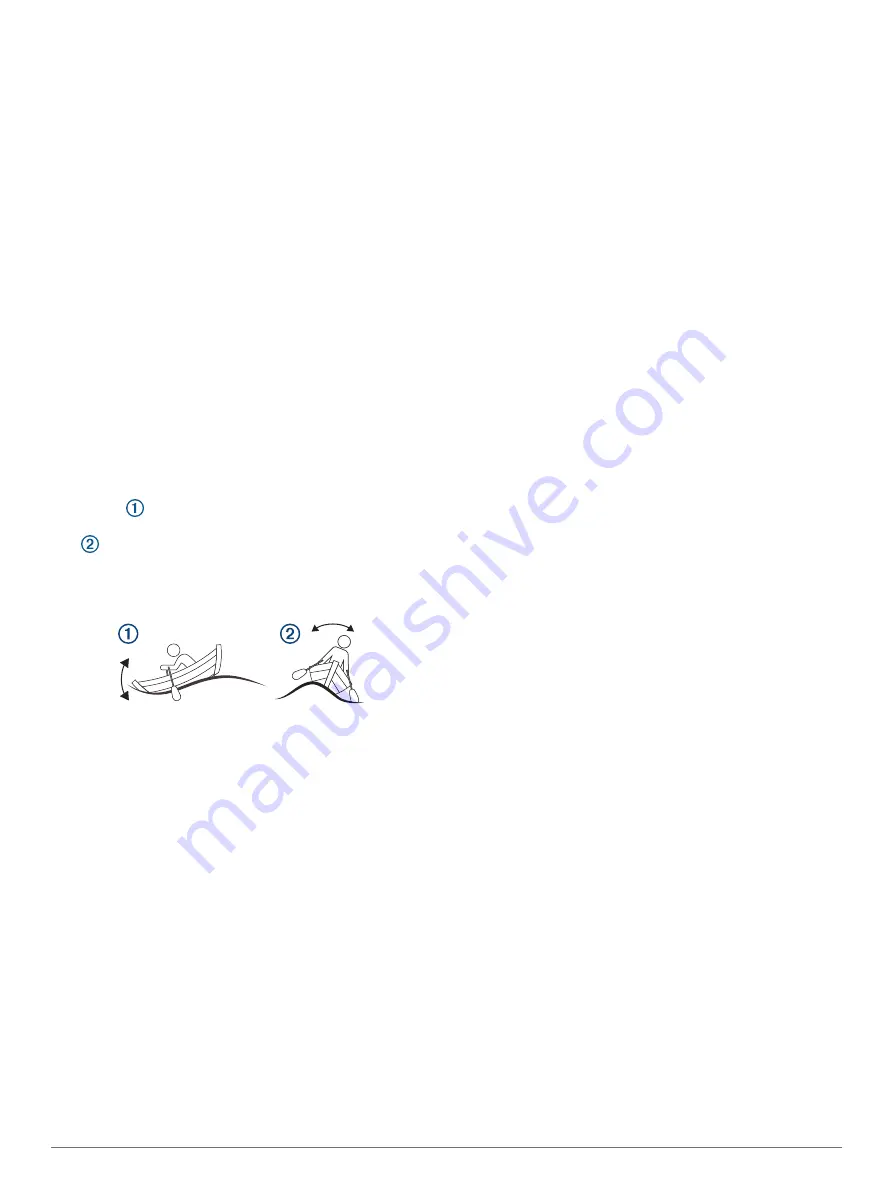
Active trim controls the amount of pitch and roll of your
boat. Pitch
is the forward and backward motion of your
boat on its center axis, relative to the surface of the water.
Roll
is the side-to-side motion of your boat on its
center axis. You can adjust the active trim to limit the
amount of degrees your pitch and roll are from your
desired trim levels.
1
Select
A/V, Gauges, Controls
>
Active Trim
.
2
Select an option:
• To adjust the forward and backward motion, select
Active Pitch
.
• To adjust the side-to-side motion, select
Active
Roll
.
Adjusting the Active Trim Sensitivity
You can adjust the active trim sensitivity to limit the
amount of degrees your pitch and roll are from your
desired trim levels.
1
Select
A/V, Gauges, Controls
>
Active Trim
>
Menu
>
Active Sensitivity
.
2
Adjust the level of sensitivity.
Viewing Graphs
Before you can view graphs of various environmental
changes, such as temperature, depth, and wind, you must
have an appropriate transducer or sensor connected to
the network.
Select
Info
>
Trip & Graphs
>
Graphs
.
Setting the Graph Range and Time Scales
You can indicate the amount of time and the range of
depth that appear in the depth and water temperature
graphs.
1
From a graph, select
Graph Setup
.
2
Select an option:
• To set a time-elapsed scale, select
Duration
. The
default setting is 10 minutes. Increasing the time-
elapsed scale allows you to view variations over a
longer period of time. Decreasing the time-elapsed
scale allows you to view more detail over a shorter
period of time.
• To set the graph scale, select
Scale
. Increasing the
scale allows you to view more variation in readings.
Decreasing the scale allows you to view more detail
in the variation.
Vessel Information
When the chartplotter is connected to a compatible EVC
2.0 Volvo Penta engine, you can view information about
the engine.
Select
Info
>
Vessel Info
.
Maintenance Assistant
When the chartplotter is connected to a compatible Volvo
Penta engine, you can view the time to the next engine
service, in engine hours remaining and days remaining.
Select
Info
>
Vessel Info
>
Maintenance Assistant
.
After you have serviced the engine, select the engine, and
select Reset Service Reminder.
Oil Level Information
When the chartplotter is connected to a compatible Volvo
Penta engine and an engine oil level sensor or a
transmission oil level sensor, you can view information
about the engine oil level and transmission oil level.
Select
Info
>
Vessel Info
>
Oil Level
.
Driveline Information
When the chartplotter is connected to a compatible Volvo
Penta engine, you can view information about the engine
type, driveline count, drive type, engine rate, electrical
system, and EVC generation.
Select
Info
>
Vessel Info
>
Driveline Info
.
EVC Network Information
When the chartplotter is connected to a compatible Volvo
Penta engine, you can view information about the EVC
network, such as features, components, software
versions, and calibration.
Select
Info
>
Vessel Info
>
EVC Network
.
Easy Connect Information
When the chartplotter is connected to a compatible Volvo
Penta engine and the installation includes a Volvo Penta
60
Vessel Information


