


Split-Zoom Sonar View
The split-zoom sonar view shows a full-view graph of sonar
readings, and a magnified portion of that graph, on the same
screen.
Select
Sonar
>
Split Zoom
.
Split-Frequency Sonar View
In the split-frequency sonar view, one side of the screen shows
a full-view graph of high frequency sonar data, and the other
side of the screen shows a full-view graph of lower frequency
sonar data.
NOTE:
The split-frequency sonar view requires the use of a
dual-frequency transducer.
Select
Sonar
>
Split Frequency
.
Pausing the Sonar Display
From a Sonar view, select
MENU
>
Pause Sonar
.
Creating a Waypoint on the Sonar Screen
1
From a sonar view, select
MENU
>
Pause Sonar
.
2
Select the location of the waypoint.
3
Select
New Waypoint
.
Viewing Sonar History
You can scroll the sonar display to view historical sonar data.
1
From a sonar view, select
MENU
>
Pause Sonar
.
2
Drag the screen or use the arrow keys.
Adjusting the Level of Detail
You can control the level of detail and noise shown on the sonar
screen either by adjusting the gain for traditional transducers, or
by adjusting the brightness for Garmin ClearVü and SideVü/
ClearVü transducers.
If you want to see the highest intensity signal returns on the
screen, you can lower the gain or brightness to remove lower
intensity returns and noise. If you want to see all return
information, you can increase the gain or brightness to see more
information on the screen. This also increases noise, and can
make it more difficult to recognize actual returns.
1
From a sonar view, select
MENU
.
2
Select
Gain
or
Brightness
.
3
Select an option:
• To increase or decrease the gain or brightness manually,
select
Up
or
Down
.
• To allow the chartplotter to adjust the gain or brightness
automatically, select an automatic option.
Adjusting the Color Intensity
You can adjust the intensity of colors and highlight areas of
interest on the sonar screen by adjusting the color gain for
traditional transducers or the contrast for Garmin ClearVü and
SideVü/ClearVü transducers. This setting works best after you
have adjusted the level of detail shown on the screen using the
gain or brightness settings.
If you want to highlight smaller fish targets or create a higher
intensity display of a target, you can increase the color gain or
contrast setting. This causes a loss in the differentiation of the
high intensity returns at the bottom. If you want to reduce the
intensity of the return, you can reduce the color gain or contrast.
1
From a sonar view, select
MENU
.
2
Select an option:
• While in the Garmin ClearVü or SideVü sonar view, select
Contrast
.
• While in another sonar view, select
Sonar Setup
>
Advanced
>
Color Gain
.
3
Select an option:
• To increase or decrease the color intensity manually,
select
Up
or
Down
.
• To use the default setting, select
Default
.
Adjusting the Range of the Depth or Width
Scale
You can adjust the range of the depth scale traditional and
Garmin ClearVü sonar views and the range of the width scale
for the SideVü sonar view.
Allowing the device to adjust the range automatically keeps the
bottom within the lower or outer third of the sonar screen, and
can be useful for tracking a bottom that has minimal or moderate
terrain changes.
Manually adjusting the range enables you to view a specified
range, which can be useful for tracking a bottom that has large
terrain changes, such as a drop-offs or cliffs. The bottom can
appear on the screen as long as it appears within the range you
have set.
1
From a sonar view, select
MENU
>
Range
.
2
Select an option:
• To allow the chartplotter to adjust the range automatically,
select
Auto
.
• To increase or decrease the range manually, select
Up
or
Down
.
TIP:
From the sonar screen, you can select or to
manually adjust the range.
Setting the Zoom Level on the Sonar Screen
1
From a sonar view, select
MENU
>
Zoom
.
2
Select an option:
• To zoom in on the sonar data from the bottom depth,
select
Bottom Lock
.
NOTE:
When the bottom lock feature is enabled, the
Range
feature changes to
Span
.
• To set the depth range of the magnified area manually,
select
Manual
, select
View Up
or
View Down
to set the
depth range of the magnified area, and select
Zoom In
or
Zoom Out
to increase or decrease the magnification of
the magnified area.
• To set the depth and zoom automatically, select
Auto
.
• To cancel the zoom, select
No Zoom
.
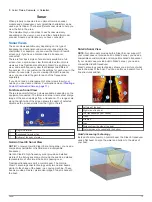
Sonar Frequencies
NOTE:
The frequencies available depend on the chartplotter,
sounder modules, and transducer being used.
Adjusting the frequency helps adapt the sonar for your particular
goals and the present depth of the water.
Higher frequencies use narrow beam widths, and are better for
high-speed operation and rough sea conditions. Bottom
definition and thermocline definition can be better when using a
higher frequency.
Lower frequencies use wider beam widths, which can let the
fisherman see more targets, but could also generate more
surface noise and reduce bottom signal continuity during rough
sea conditions. Wider beam widths generate larger arches for
fish target returns, making them ideal for locating fish. Wider
beam widths also perform better in deep water, because the
lower frequency has better deep water penetration
Chirp frequencies allow you to sweep each pulse through a
range of frequencies, resulting in better target separation in
deep water. Chirp can be used to distinctly identify targets, like
14
Sonar
Summary of Contents for AQUAMAP 80 Series
Page 1: ...AQUAMAP 80 100 Series Owner s Manual November 2016 Printed in Taiwan 190 01657 00_0C...
Page 6: ......
Page 35: ......


