


3 - 9
d)
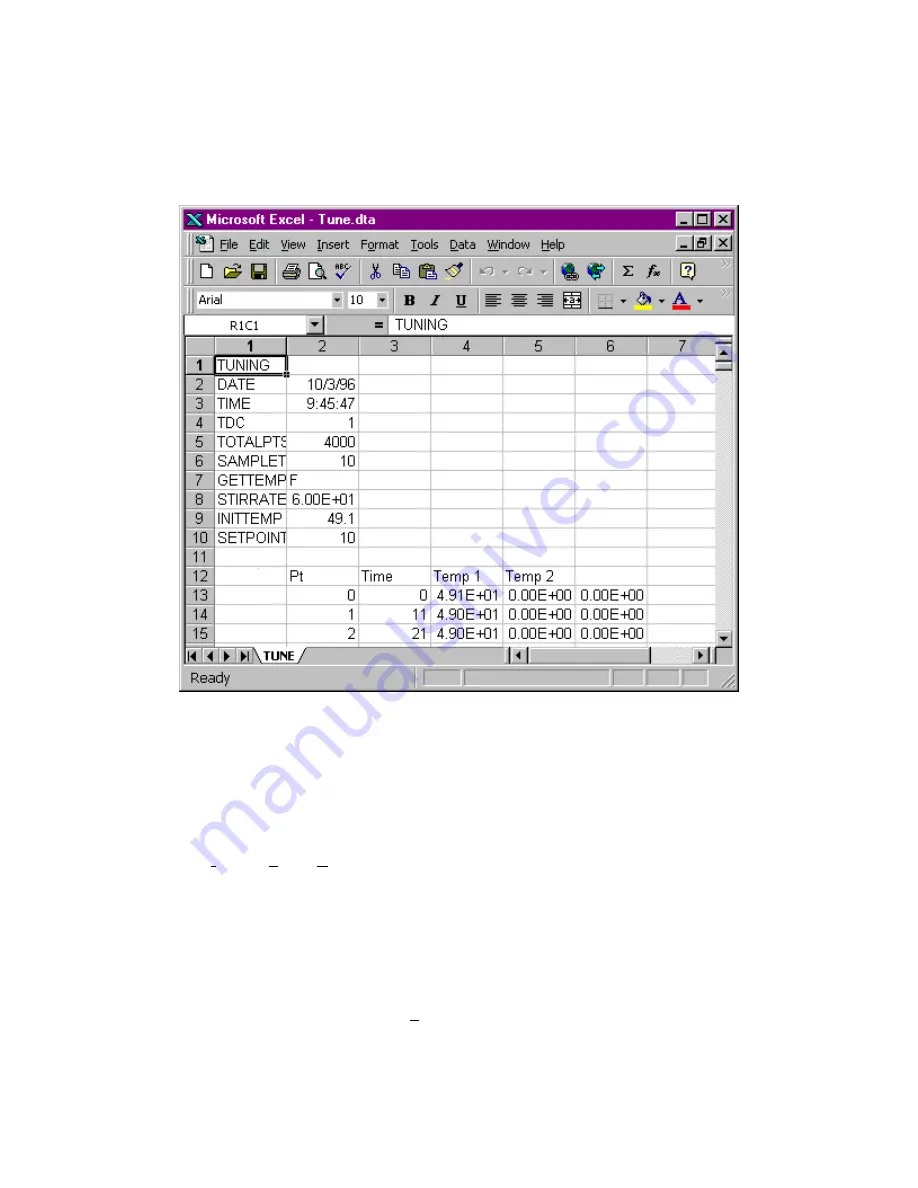
The Excel window should eventually look something like Figure 3-6.
Figure 3-6
TUNE.DTA File in Excel
e)
Highlight the first hundred points or so of the two data columns labeled Time and Temp1.
These are the point to be included on the graph.
You may have to experiment with the number of points that you graph. If you select too many
points, you lose resolution in determination of the deadtime (see below). If you select too few
points, the slope can be difficult to determine.
f)
Select
Insert, Chart>, On This Sheet
from the Excel menu.
g)
Drag the cursor over a blank area of the sheet to define the chart area. The area should be at
least 4 columns wide by 10 rows tall.
h)
In the next dialog box, select
Next>
to accept the data range, because you have already
highlighted the appropriate data ranges.
i)
In the next dialog box, select an
XY (Scatter)
chart, then select
Next>
j)
Select any of the linear chart options, then select
Next>
.
Summary of Contents for TDC4
Page 15: ...2 6...