3.1.3 GPS
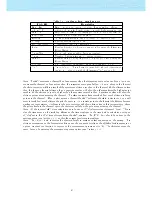
The GPS Element provides graphical indication about the current GPS signal quality. Basically, the
lower the PDOP value (position dilution of precision), the more accurate calculations are for determining
position. Values bellow 3.0 are fairly accurate. The relationship between what is shown and the signal
quality can be seen in Table
3.3
. Note that FAI rules require 3D tracklog data, which includes GPS
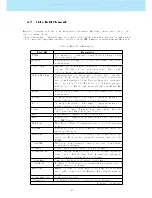
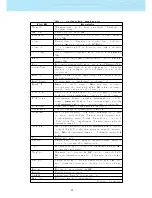
Table 3.3: GPS signal quality
Symbol Description
3D position with a PDOP bellow 1.5
3D position with a PDOP between than 1.5 and 2.0
3D position with a PDOP between than 2.0 and 3.0
3D position with a PDOP greater than 3.0
2D position (no altitude information)
No GPS Signal
altitude. Therefore the GPS will only start recording a tracklog when 3D information is available. The
GPS has an high sensitivity 50 channel GPS receiver which oers unmatched tracking performance in
harsh signal environments (-160 dBm sensitivity), and very short acquisition times. The GPS has a 4 Hz
GPS update rate (most of others only provide 1Hz) which allows the GPS pilot to see very small speed and
position changes. Furthermore, the movement of the direction arrow is smoother and any position change
is shown in a quarter of the time of other devices. Note that the 4 Hz update rate requires more than 5
satellites in view. More information about GPS accuracy and also other GPS related information can be
seen in (
http://en.wikipedia.org/wiki/Error_analysis_for_the_Global_Positioning_System
).
3.1.4 Vario
The Analog Vario Elements shows information regarding the analogue instantaneous vertical speed. There
are four dierent Elements that can be used to display the vario. All of these element can be resized and
re-positioned.
Analog Vario
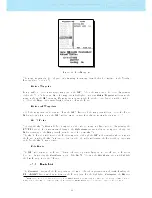
This Element which can be resized and repositioned, graphically represents the rate of climb, scaled from
0 m/s to +/-10 m/s depending if you are climbing or sinking Figure
3.1
.
Figure 3.1: Analog Vario
When the GPS detects that the pilot is climbing, a black bar starts to grow on the left, from the bottom
of the scale to the top ,with 0.1 m/s increments. The same bar grows on the right, from the top of the
scale to the bottom, if sinking is detected.
9
All manuals and user guides at all-guides.com


