


114
4 The FIS-Viewer
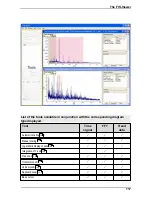
4.1 The working interface
4.1.1 Interface areas
·
The toolbar
contains various tools which can be used to arrange the
diagrams and display/remove the tool area and diagram information bar as well
as other tools which can be used to export measurement data, display the
corresponding configuration for the data set selected and create a measurement
report.
·
You will find a range of navigation tools in the tools
working area which can
be used to modify the way in which the diagrams are presented and also find a
number of different cursor tools for carrying out fault analyses. The choice of
tools which can be used varies according to the type of diagrams displayed
(FFTs, time signals or trend data).
·
The main area of the working interface contains the diagram
and the cursor
and measuring information
area in which the corresponding values for the
cursor selected are displayed.
·
You will find additional information in the diagram information bar
(on
measurement data for example) depending on the diagram type displayed. You
can use the tools in this working area to do the following:
o
enter comments into the diagram
o
select frequency bands with FFTs in order to determine characteristic values
for the fault analysis
o
determine the maximum, harmonic or sideband values from the diagram
depending on the cursor type
The diagram information bar area for each diagram can be displayed or removed
as required and can be used to increase the diagram area.
115
116
122
123
125


