background image

Token Ring Statistics

3-20

Port Level Statistics

Figure 3-11. The Station Statistics Window

The Station Statistics Window General Fields

The Station Statistics window contains the following fields:

Station Name

Use this editable field to assign a name to the station attached to the selected port.

Location

Use this editable field to assign a drop number to the station attached to the 
selected port.

Link Time

The length of time (in days, hours, minutes, and seconds) that the selected station 
has been inserted into the ring.

The Station Statistics Window Performance Fields

The following fields give general performance information for the selected 
station.

Total Frames

The total number of frames transmitted by the selected station port since its 
attached station inserted into the ring.

Total KBytes

The total number of kilobytes transmitted by the selected station port since its 
attached station inserted into the ring.

Summary of Contents for NetSight Element Manager

Page 1: ...MicroMMAC T User s Guide...

Page 2: ......

Page 3: ...ed Software is virus free Copyright April 2000 by Enterasys Networks All rights reserved Printed in the United States of America Order Number 9031583 04 April 2000 Enterasys Networks P O Box 5005 Roch...

Page 4: ...ter AT Operating System 2 Personal System 2 RISC System 6000 and Workplace Shell are trademarks of International Business Machines Corporation i960 microprocessor is a registered trademark and Intel a...

Page 5: ...operative 3 Reproduced for safekeeping archives or backup purposes 4 Modified adapted or combined with other computer software provided that the modified combined or adapted portions of the derivative...

Page 6: ...iv...

Page 7: ...sis Manager Window 2 12 Viewing Hardware Types 2 12 Device Type 2 13 Module Type 2 13 Managing the Hub 2 13 Management Station Configuration 2 14 Accessing the TR Management Station Configuration Wind...

Page 8: ...2 Setting the Statistics Poll Interval 3 3 Network Level Statistics 3 4 Accessing the Network Statistics Selections 3 4 The Network Statistics Window 3 4 General Information Fields 3 4 Ring Status Fi...

Page 9: ...Window from the Port Menu 4 5 Accessing the Station Alarm Limits Window from the Station List 4 6 Accessing the Station Alarm Limits Window from the Station Map 4 6 Setting Station Level Alarm Limits...

Page 10: ...Contents viii...

Page 11: ...models are functionally identical the only difference among them is the configuration of the front panel ports the MicroMMAC 22T has 12 built in active UTP RJ45 lobe ports the MicroMMAC 24T has 24 bui...

Page 12: ...ated documentation describes certain software conventions and shows you how to contact the Enterasys Networks Global Call Center Chapter 2 The MicroMMAC T Chassis View describes the visual display of...

Page 13: ...m and Event Handling User s Guide Enterasys Network Troubleshooting Guide Microsoft Corporation s Microsoft Windows User s Guide For more information about the capabilities of the MicroMMAC T consult...

Page 14: ...er over the indicated target then press and release the appropriate mouse button This is most commonly used to select or activate objects such as menus or buttons Double clicking means to position the...

Page 15: ...n to confirm each individual set in other windows you can set several values at once and confirm the sets with one click on the button The button brings up a Help text box with information specific to...

Page 16: ...nagement for the MicroMMAC T they cannot be changed via NetSight Element Manager Location Displays the user defined location of the device The location is entered through the System Group window see t...

Page 17: ...e Refer to Chapter 2 for information on the Chassis View and Chassis Manager windows Getting Help from Enterasys Global Call Center If you need technical support related to NetSight Element Manager co...

Page 18: ...ys Web site http www enterasys com NOTE For the highest firmware versions successfully tested with NetSight Element Manager 2 2 1 refer to the Readme file from the NetSight Element Manager program gro...

Page 19: ...oint of access to all other MicroMMAC T windows and screens which are discussed at length in this and the following chapters To access the MicroMMAC T Chassis View window use one of the following opti...

Page 20: ...isplay as detailed later in this chapter or by using the menu bar at the top of the Chassis View window you can access all of the menus that lead to more detailed device network module and port level...

Page 21: ...ished with the MicroMMAC T Red indicates it is not responding to device polls device is off line or device polling has failed across the network for some other reason UpTime The amount of time in a da...

Page 22: ...twork module and port level options as well as utility applications that apply to the device The following illustration displays the menu structure and indicates where to click to access the various m...

Page 23: ...evice being modeled see Viewing Hardware Types page 2 12 for details NOTE Additional menus e g FDDI and or menu options may be available from the Chassis View if you have a BRIM installed in the Micro...

Page 24: ...anagement station including setting a device name and location setting the error report timer delay enabling or disabling the automatic beacon recovery process ABRP and inhibiting the active monitor Y...

Page 25: ...alarms window see Chapter 4 Token Ring Alarms for alarm configuration information Station List which allows you to view and configure the stations on the currently monitored ring network see Chapter 5...

Page 26: ...u to enable or disable all ring ports on the selected module These selections will only appear in the Module menu for modules which have ring in out ports See Enabling and Disabling Ports page 2 31 fo...

Page 27: ...llowing selections Ring Port Status which invokes the Ring Port Status window See Viewing Ring Port Status page 2 21 for details Enable Disable which allow you to administratively enable or disable th...

Page 28: ...disabled by management and there is a station linked to that port INS inserted when the port has been enabled by management and there is a station linked to that port If you have selected the Admin st...

Page 29: ...pped when there has been a termination of data communications at the port and data has been rerouted to the backup path Port Status Color Codes The port display options incorporate the following color...

Page 30: ...component might contain objects from several different proprietary MIBs and RFCs The Chassis Manager window Figure 2 3 is a read only window that displays the MIBs and the MIB components and therefore...

Page 31: ...own to Module Type A Module Type text box similar to the example shown in Figure 2 5 will appear describing the module type If Module Type is not supported by the selected module Unknown will appear i...

Page 32: ...the Configuration selection The TR Management Station Configuration window will appear The TR Management Station Configuration window Figure 2 6 allows you to specify the ring functions that the on bo...

Page 33: ...identifier The station s physical drop is an administratively assigned numeric string that you can use to identify a station s physical location If assigned the drop will appear as a subvector in cert...

Page 34: ...covery If the Automatic Beacon Recovery Process ABRP option is enabled the selected management station will automatically attempt to repair its ring when it detects an unusually high concentration of...

Page 35: ...val in seconds by clicking on the appropriate I bar cursor and entering the desired value in the resulting window Allowable values for of Ring Port Retries are 0 100 and 999 where 0 will disable retri...

Page 36: ...ore than one ring network residing in your hub you can view information for each ring by using the Previous and Next buttons By default the rings are identified only by an index number Ring 1 is the M...

Page 37: ...includes only those inserted stations physically present in the same hub as the MicroMMAC T and only those which are part of the MicroMMAC T s management domain Ports Enabled This field indicates the...

Page 38: ...for the desired module The Module menu will appear 2 Drag down to Status The Token Ring Board Status window will appear Figure 2 10 The Token Ring Board Status Window Token Ring Board Status Window F...

Page 39: ...ode AutoMode This field indicates whether the module is in Management Mode hardware defaults have been altered through NetSight Element Manager or is in AutoMode set to operate according to hardware d...

Page 40: ...e MicroMMAC T was reset or the date and time that a wire fault on the selected port last occurred Media Type This field allows you to select the media type of the ring port This field does not apply t...

Page 41: ...e concentrator to a module that supports autowrap you must disable the phantom current to the module that supports autowrap for the connection to be valid Remember though once you have disabled the ph...

Page 42: ...n Cancel to cancel Using an Uninterruptable Power Supply UPS Your MicroMMAC T supports the use of a UPS uninterruptable power supply through the COM 1 port For more information on the use of a UPS wit...

Page 43: ...ount of time that your UPS has been running since the last start up The line voltage and battery output The actual battery capacity of the UPS dynamic bar graph You can also use a button at the bottom...

Page 44: ...rted up Line Voltage Displays the voltage coming through the line attached to the MicroMMAC T Battery Output Displays the amount of battery output voltage Battery Capacity Displays the percentage of r...

Page 45: ...bove Using the Test Option You can use the test option to activate a self test cycle for your unit This self test will check the viability of your unit and its battery To activate the test 1 Click on...

Page 46: ...device to the hub such as a ring analyzer that does not participate in the normal operation of token ring protocol In this case you will want to disable Port Mapping for the port to which that device...

Page 47: ...r remove themselves from the ring i e the port status changes from INS to ENB By default these traps are disabled at a station to reduce the amount of management traffic on your network You can use Ne...

Page 48: ...in the Chassis View window The Board pull down menu will appear 2 Click on Enable Link Traps or Disable Link Traps as desired Link traps will be enabled or disabled for all ports on the selected board...

Page 49: ...le the ports or Disable Station Ports to disable the ports The module s station ports will now be enabled or disabled as desired To enable or disable an individual station port 1 Click on the Port Ind...

Page 50: ...rt into a ring out port The converted port will assume the full functionality of a ring out port and will reflect as such in the Chassis View window The port status will now display as that of a ring...

Page 51: ...eld lists the amount of time in a days hh mm ss format that the device has been running since the last start up Index The index value assigned to each interface on the device Type The type of the inte...

Page 52: ...refresh to reflect the current choice as described below Raw Counts The total count of network traffic received or transmitted on the indicated interface since device counters were last reset Raw cou...

Page 53: ...e number of bytes transmitted by this interface expressed as a percentage of the theoretical maximum load When you select this option a Bar Graph field will be added to the interface display area this...

Page 54: ...he selected port ethernet csmacd The lower portion of the window provides the following transmit and receive statistics note that the first four statistics are also graphically displayed in the pie ch...

Page 55: ...Displays the number of packets received or transmitted that contained errors These statistics are displayed in the pie chart color coded red Unknown Protocol Received only Displays the number of packe...

Page 56: ...d To calculate the percentage of outbound packets that were discarded Transmit Discards Packets Transmitted NOTE Unlike the Interface Detail window which this window replaces the Interface Statistics...

Page 57: ...e and protocol statistics and performance graphs Statistics Window Features Many of the token ring statistics windows allow you to measure and view statistics according to different scales and set a t...

Page 58: ...irst inserted These totals are read from the device and updated at each subsequent polling interval Click on the Delta radio button After the completion of the current polling cycle plus two more poll...

Page 59: ...h instance of a statistics window by using the clock symbol found in the Statistics and Timer Statistics windows Note that the poll interval returns to its default value each time you close and then r...

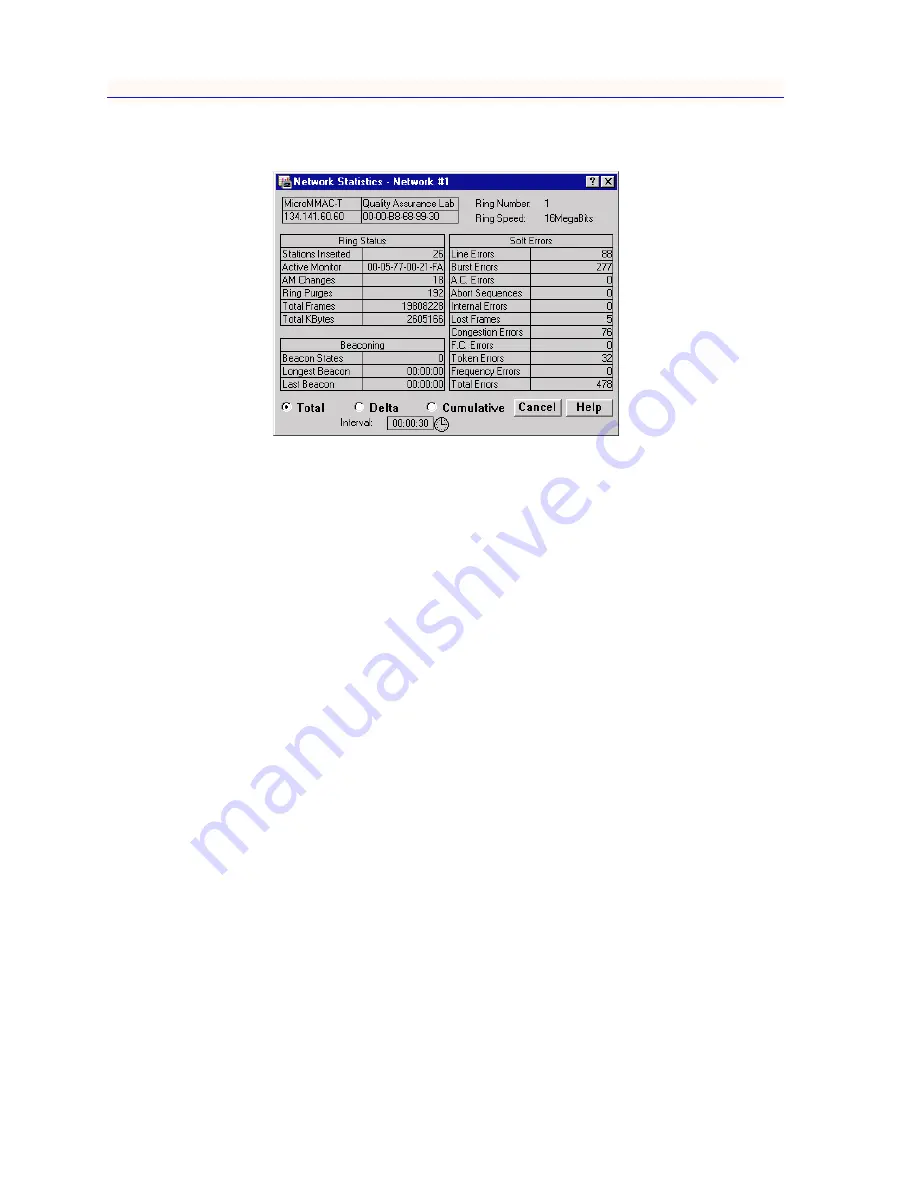
Page 60: ...raphs Frame Size Protocol Accessing the Network Statistics Selections To access the Network Statistics selections 1 At the MicroMMAC T Chassis View window click on the Network menu selection then on t...

Page 61: ...otal Delta or Cumulative Counts page 3 1 for details Set the time interval to update information from 1 second to 23 hours 59 minutes 59 seconds by using the clock symbol at the bottom of the window S...

Page 62: ...d Last Beacon fields are read from the device Total update and are not subject to Delta or Cumulative update options Beacon States This field lists the count of beaconing occurrences on the ring Longe...

Page 63: ...han one Active Monitor Present AMP or Standby Monitor Present SMP frame with the Address Recognized Indicator ARI and Frame Copied Indicator FCI bits set to 0 without receiving an intervening AMP fram...

Page 64: ...the hard coded address on the adapter and duplicate addresses are checked for when a station inserts itself into the ring However a system administrator can pass a locally assigned address to the ada...

Page 65: ...have set See Viewing Elapsed Average and Peak Activity Levels page 3 2 for details about the Timer Statistics chart measurements You can also refresh the statistics at any time by clicking on the Cle...

Page 66: ...u the amount of traffic going through the network as well as the number of network events errors ring purges or beacon states it has experienced You select the type of events to monitor by using the b...

Page 67: ...s theoretical maximum load 4 or 16 Mbits sec Nothing The Traffic scale is not currently measuring the traffic or load processed by the network Configuring the Network Performance Graph 1 Using the mou...

Page 68: ...dow These frame size statistics are presented in numerical bar graph and pie chart form Total and Delta Graph Display You can choose whether to view the total count of frame sizes Total or to view the...

Page 69: ...up Using the Pie and Bar Radio Buttons You can use the Pie and Bar radio buttons to switch from the bar graph to the pie chart to view the size of frames passing through the MicroMMAC T Both graph typ...

Page 70: ...Manager Magenta All other protocols Orange These protocol statistics are presented in numerical bar graph and pie chart form Total and Delta Graph Display You can choose whether to view the total coun...

Page 71: ...hart or bar graph 1 Click on the Pie or Bar radio button The Pie chart or the Bar graph as you have selected will appear on the window Management Station Statistics Through the Device menu you can vie...

Page 72: ...ing interval Delta or accumulated from zero at a user defined point Cumulative See Setting Total Delta or Cumulative Counts page 3 1 for details Set the time interval to update information from 1 seco...

Page 73: ...lack of internal buffering FC Errors The management station s count of PDU detected on the ring with the A bits already set to 1 which indicates a possible electrical line disturbance or a duplicate...

Page 74: ...of the phantom current A station detecting this condition will remove itself from the ring Remove Frames Indicates that a Remove MAC frame has been detected on the ring A Remove MAC frame forces the r...

Page 75: ...Graph 3 Click the mouse to highlight your selection The associated window will appear Each window is described in the following three sections The Station Statistics Window The Station Statistics win...

Page 76: ...e station attached to the selected port Link Time The length of time in days hours minutes and seconds that the selected station has been inserted into the ring The Station Statistics Window Performan...

Page 77: ...uences The number of times the selected port has transmitted abort sequences during transmission Internal Errors The number of recoverable internal errors detected by the selected port indicating that...

Page 78: ...val text box at the bottom of the screen Figure 3 12 Station Timer Statistics Window Two fields directly above the bar graphs identify the currently selected port by its board and port number and its...

Page 79: ...es Displays the elapsed average and peak levels of good frames generated by the station attached to the port Errors Displays the elapsed average and peak levels of errors received by the station port...

Page 80: ...If you change the parameters the Performance Graph will refresh and the button label will change to reflect the selection Using the Traffic button with the blue square marker to its left at the botto...

Page 81: ...marker to its left The Total Errors pull down menu will appear 2 Click on the desired Total Errors mode Total Errors or Nothing The mode you have chosen will appear in the button The Performance Graph...

Page 82: ...Token Ring Statistics 3 26 Port Level Statistics...

Page 83: ...an configure and set station level alarms for individual stations on a ring Ring Level Alarm Limits When you access the Alarm Limits window Figure 4 1 from the Network menu you can configure and set a...

Page 84: ...Network Events The following thresholds listed in the section of the window labeled Ring Errors are based on the number of occurrences of the selected event on the ring within a user defined time int...

Page 85: ...f frames that can be transmitted on the ring within the time base before the alarm limit is reached For a network running at 16 Mbits sec the default value is 33 890 This number represents the maximum...

Page 86: ...A or C bits The default value is 2 Rx Congestion The threshold at which the port cannot copy a frame addressed to it because of a lack of internal buffering The default value is 124 Setting Ring Level...

Page 87: ...ide for more information on viewing the alarm logging facility Station Level Alarm Limits You may also set Station level alarm limits for individual stations on the currently monitored ring network vi...

Page 88: ...ndow Figure 4 2 will appear 5 Set the station alarm limits as instructed in the Setting Station Level Alarm Limits section below Accessing the Station Alarm Limits Window from the Station Map To acces...

Page 89: ...the alarm is activated 4 Highlight the hour minute or second field and type the desired interval in each or click the cursor in the desired field and click on the appropriate arrow to scroll the inter...

Page 90: ...ts are now set When an alarm threshold is exceeded an alarm will be generated To view a list of the alarms check NetSight Element Manager s alarm logging facility Refer to the Alarm and Event Handling...

Page 91: ...ce graphs for each inserted ring station including the MicroMMAC T s onboard management station and also remove stations from the ring You can also set alarm limits for individual stations through the...

Page 92: ...ing you are monitoring Note this address always displays in Canonical format Number of Nodes Stations The number of stations inserted into the ring that you are monitoring Address Mode The Address Mod...

Page 93: ...ex into which the station is inserted Note that if the station is not attached to the MicroMMAC T this field will list unknown since no link is detected to the MicroMMAC T itself Total Soft Errors The...

Page 94: ...at its MAC adapter is functioning correctly If the station fails the loopback test it will stay off the ring If it passes the test its actions will depend on the adapter s manufacturer Cabletron DNI c...

Page 95: ...ienced at the particular port To view a station s performance graph 1 Click on the Performance Graph radio button at the bottom left of the window 2 Double click on the station for which you want to v...

Page 96: ...ation Statistics windows for stations attached to the currently monitored ring Although statistics are only reset for the stations attached to the currently monitored hub the reset will be reflected i...

Page 97: ...p window will appear Station Map Window Fields Active Monitor Indicates the physical address of the Active Monitor on the ring Note this address always displays in Canonical format Number of Nodes Ind...

Page 98: ...roMMAC T is initially presented in one of two positions If the entire ring fits in the display panel the MicroMMAC T is represented by the topmost 12 o clock station square If the ring exceeds the pan...

Page 99: ...isappear by positioning the cursor on the box and pressing the left mouse button Each station text box contains the following information Name The name assigned to the station through remote managemen...

Page 100: ...k on this option to remove the selected station from the ring so that it can perform a loopback test When you click this button the MicroMMAC T sends a Remove MAC Frame to the selected station Upon re...

Page 101: ...idual node text boxes will disappear Figure 5 4 Station Map in Zoom Mode with Command Menu Left Right Button Double Click When Cursor is Near Station The display will zoom to the vicinity of that node...

Page 102: ...roll box reaches its upper or lower limit you can only continue scrolling in the same direction by using the scroll arrows Page Up Click on Track Above Scroll Box Rotates the ring counterclockwise by...

Page 103: ...ap window just like any other window by moving the cursor to the window s boundary the cursor will display as a two headed arrow depressing the left mouse button and dragging to shrink or expand the w...

Page 104: ...The Station List and Station Map 5 14 The Station Map...

Page 105: ...on 2 3 BRIM 1 1 2 5 2 9 buffer space 2 37 Burst 4 4 Burst Errors 3 7 3 16 3 21 BYP bypassed 2 10 C Cancel button 1 5 Chassis Information 2 2 Chassis Manager Window 2 12 Claim Tokens 4 3 color codes 2...

Page 106: ...6 3 21 Line Voltage 2 26 Link Time 3 20 Link Traps 2 29 LNK linked 2 10 Load 2 10 2 35 Lobe Wire Fault 3 18 Location 1 6 3 20 Logical Status 2 33 Longest Beacon 3 6 Lost Frames 3 8 3 17 3 21 4 3 M MAC...

Page 107: ...s 2 11 2 21 Ring Ports 2 21 Ring Ports On 2 21 Ring Purges 3 6 4 2 Ring Speed 3 5 Ring Speed Fault 2 21 Ring View 2 11 Ring Level Alarm Limits 4 1 Ring Level Station Alarms 4 3 Rotating the Station Ma...

Page 108: ...Timer Valid Transmission 3 8 U Unicast 2 36 Unit Failed 2 26 Unit in test 2 26 Unit OK 2 26 Unknown Protocol 2 37 Up 5 9 Up Time 2 33 UPS ID 2 26 UPS Uptime 2 26 UpTime 2 3 Utilities Menu 2 7 V Viewin...

Reviews: