Elma 1352C
35
2.
How to save the recorded real time data to a file?
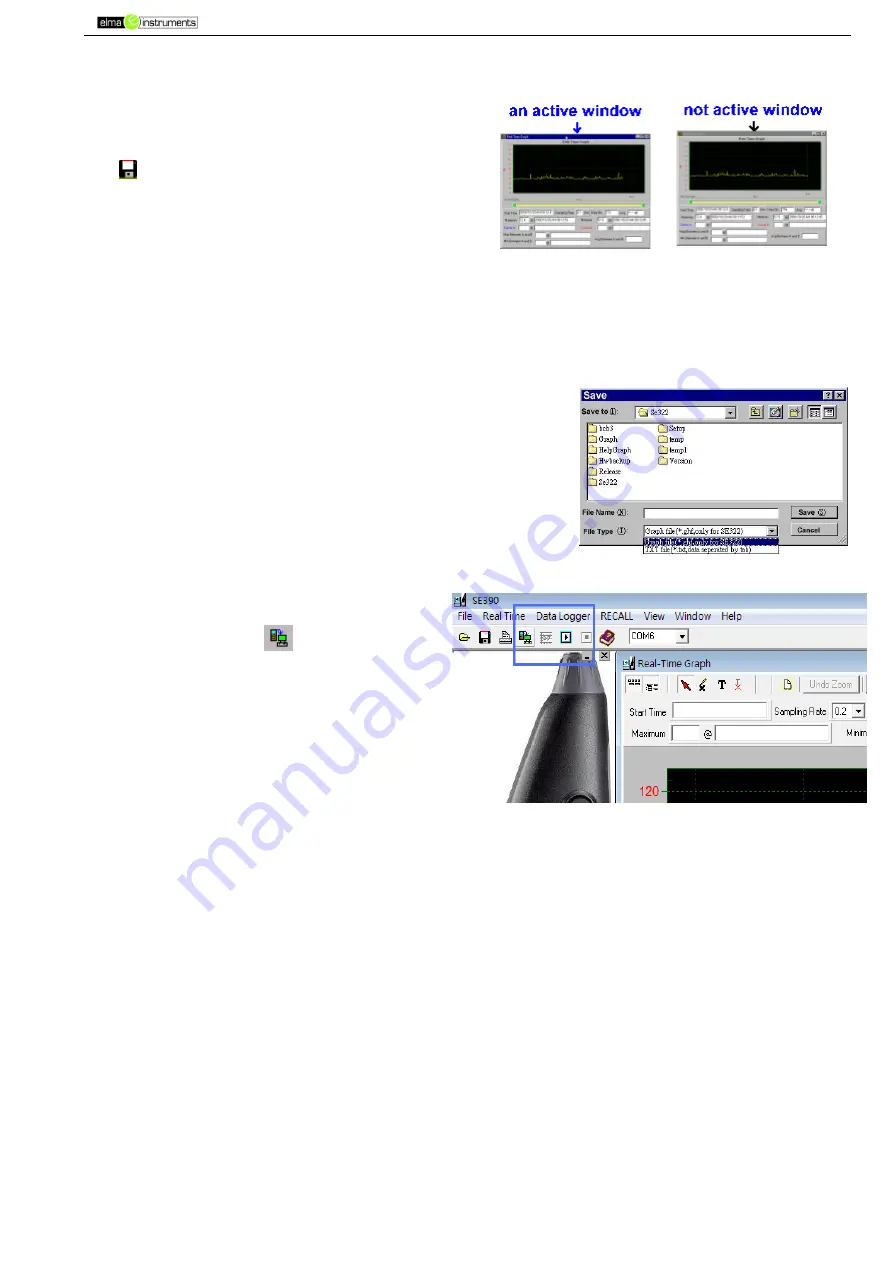
Click the graph window you want to save and
the graph window will become active , then
choose File | Save from main menu or click
from the tool bar .
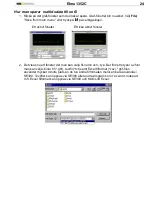
There will be a save dialog window for you to
choose the file name and file type to save.
There are three types of file name you can
choose, binary file(*.ghf), text file(*.txt) and EXCEL format file(*.csv). The *.ghf file use
much fewer disk space to save the data than the other two file format, but it can only be
used in SE390. Text file can be opened by SE390 and any other word processor
program like word, notepad etc. EXCEL format file can be opened by SE390 and
Microsoft EXCEL.
3.
How to load the recorded data from the memory of
Sound Level Meter and save it to a file?
(Only for the model with Data Logger)
Power on the Sound Level Meter.
Press the REC button of the meter to start
recording data
After a while, press REC button again to stop
recording data.
Connect the Sound Level Meter to PC
Start SE390 program.
Choose Data Logger from main
menu or click
from tool bar.
4. In reference to Data Logger, see
DataLogger.
Frequently Asked Question:
1. I had connected Sound Level Meter to PC serial port and turned meter power on, but it
still shows "NO CONNECTION".
Answer:
It could be that all serial port are occupied by other application, close all other
application. If it still don't work. Restart your computer and run SE390 again.
2. How can I save the graph to a file which can be used in EXCEL?
3.
Answer:
When you save a graph to a file, the default file format is "*.ghf" and you can
select *.csv to save files. CSV is an EXCEL file format. You can open it in EXCEL.
4. How to uninstall SE390?
5.
Answer:
Uninstall SE390 by launching the Add/Remove Programs applet out of the
Control Panel, highlighting the SE390, and clicking on the Add/Remove... push button,
then it will remove the SE390 folder and files from your computer.
6. Why loading data fail?
Answer:
This might cause by the slow respond from some of the notebook PC system.
7. How to zoom the graph?
Answer:
Press the left mouse button and drag the cursor to select the new extents, and
then release the mouse button.
8. When I setup the real time sampling with a fast rate (eg. 0.1 sec), some of the sampling
data might be lost.
Answer:
This might be caused by slow response time of the PC.

