Elma 1352C
33
Install SE-390:
1. We recommend close all other application before installing SE390.
2. Insert setup CD disk to CD disk drive.
3. Choose the Start button on the Taskbar and select Run.
4. Type E:\SETUP and choose OK, then it will copy SE390.exe ( executable file ) and help
file to your hard disk ( default is c:\program files\SE390 ).
For detailed other operation instruction, please refer to the online help while executing
SE390.
Main Menu
File | Open- Retrieve files from the disk.
Save - Save the active window (when the caption bar is highlighted) data to the disk.
Print - Print the data of the active window(graph or list).
Printer Setup - Select printer.
File | Exit: Terminates SE390 program.
View | Control Panel: By opening the Panel Window, the user can control meter via the
button in this window.
View | Real-Time Graph: Open Real-Time Graph display to graph the present data.
Real Time Data | Run - Start collecting real time data.
Stop - Stop collecting real time data.
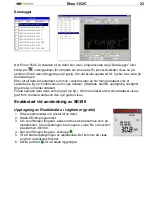
DataLogger: By opening the DataLogger Window, the user can load recorded data of meter
to PC in this window.
Output To Graph - Graphing tabular data.
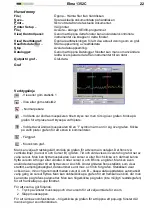
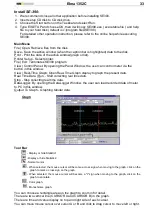
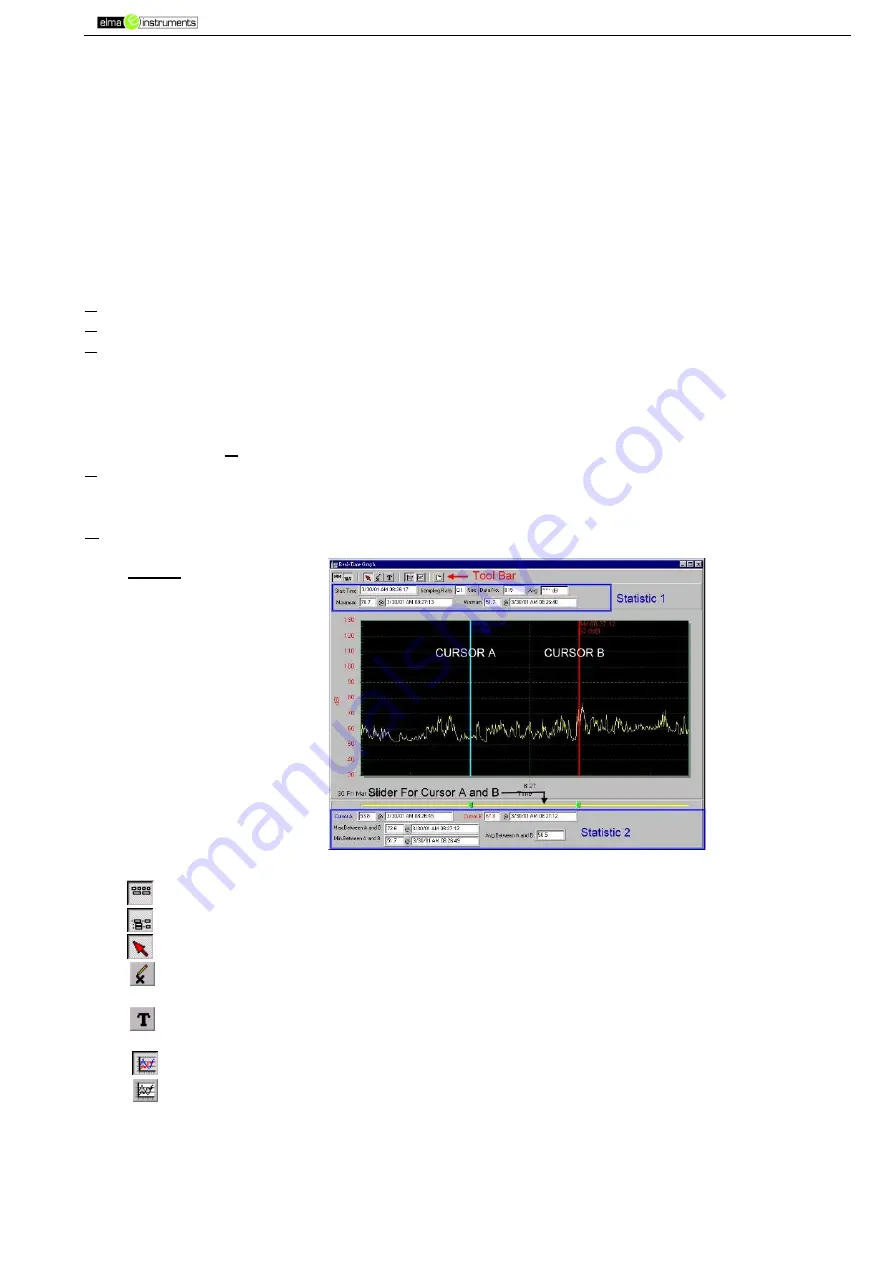
Graph
Tool Bar
- Display or hide Statistic1.
- Display or hide Statistic2.
- Normal cursor.
- When selected, the mouse cursor will become a cross sign when moving to the graph, click on the
graph to mark a cross sign on the graph.
- When selected, the mouse cursor will become a "I" sign when moving to the graph, click on the
graph to annotate.
- Color graph.
- Monochrome graph.
You can choose a rectangle area on the graph to zoom in for detail.
There are two vertical line (CURSOR A and CURSOR B) in the graph.
There are time and value display on top and right side of each cursor.
You can move mouse cursor over cursor A or B and click to drag cursor to move left or right.

