Page 33 of 47
Catalog #91001, 91003, 91004, 91005, 91007, 91009
Rev. 9/06 - RS/mc
©2006 Edelbrock Corporation
Brochure #63-0282
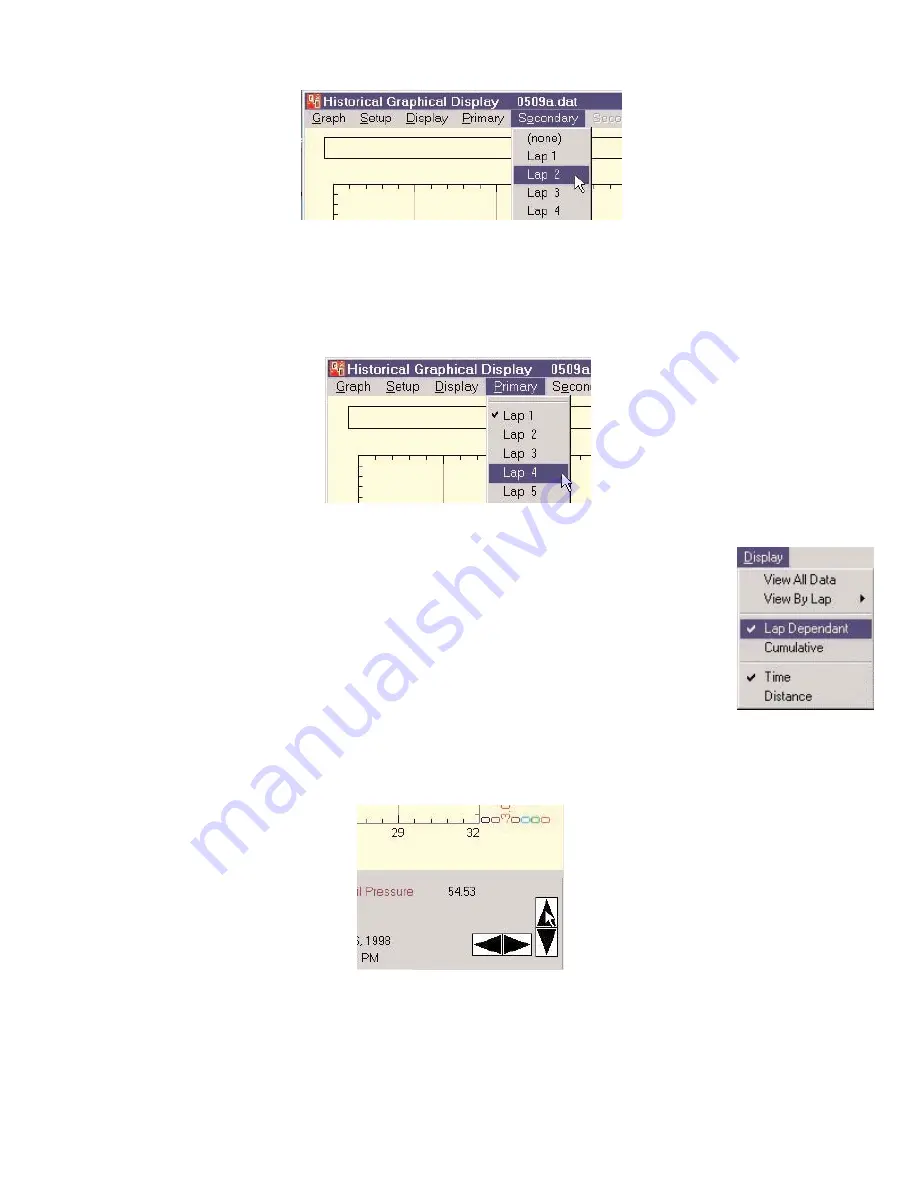
To overlay a secondary lap, select the desired lap from the “Secondary” menu. The secondary lap will be represented by dotted lines
on the graph.
The lap times of both the primary and secondary laps will be displayed at the bottom of the screen. You can switch between which
values are displayed at the bottom of the screen (primary or secondary lap) by clicking the right mouse button. The currently active
lap will be shown in red. To remove the secondary lap from the graph select “None” from the “Secondary” menu. To return to viewing
data in a non-lap dependent mode, select “View AU Data” from the “Display Menu”.
Viewing Data as Lap Dependent or Cumulative
When you are viewing lap data, you have the choice of viewing it as “Lap Dependent” or “Cumulative”. If
you view it as lap dependent, the time at the start of the lap will become"0".
If you view it as “Cumulative”, the time will be the actual time into the race.
NOTE:
Data will always view as “Lap Dependent” if you are comparing primary and secondary laps.
Zoom In / Zoom Out
There are two basic ways to zoom in or magnify the Historical Graph display. Using the Up arrow key on the keyboard, or clicking on
the up facing arrow on the bottom right of the screen will magnify the graph by two about the center of the screen.
Summary of Contents for QwikData 91001
Page 51: ......


