


GGGGGGGGGGGGGGGGGGGGGGGGGGGGGGG
G
54
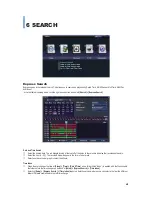
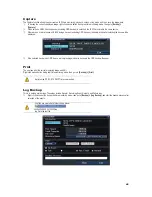
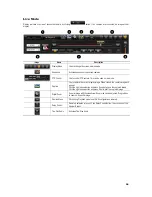
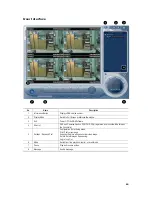
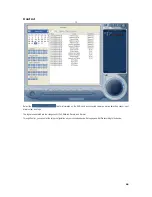
System Log
Displays recorded event log information for each day.
Go to
[Menu] > [ Information] > [System Log].
ཛ
Go to
[Setup] > [Information] > [System Log]
; then the System Log window will appear.
ཛྷ
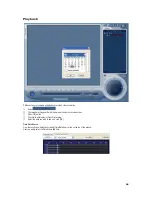
Using the mouse or the arrow keys and SELECT button, select a desired date on the activated Calendar.
ཝ
The user can check the time and the log type by using the arrow keys in the log list.
ཞ
Use the Up/Down button to check the logs by time and type on each page.
ཟ
The user can shift the focus to a specific time zone to play a certain time. (Playback will start from the point when logs are saved.)
འ
Click the right-mouse button or select SETUP button on the front panel and select Hour
to move the desired log time zone
.
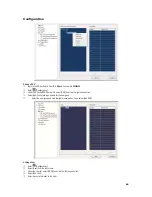
Log Type
Categorizes the event type. User can select the different categories to display the logs of the specific category.
All
:
Logs related to all system operations. All categories will be displayed.
Fail
:
Logs related to system operation failures including signal loss and network connection failure.
Network
:
Logs realted to network operations including Network Login, Network Logout, and Network Live.
Rec Event
:
Logs related to the recording including Motion Detection, Sensor Detection, and Audio Detection.
Normal
:
Logs are related to Power ON/OFF, Backup Failure, Setup Start, Setup End, Playback, and other basic system operations.
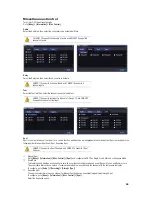
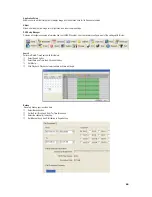
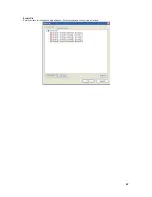
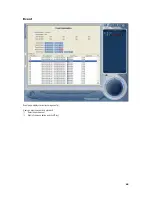
Time Changed Log Data View
The stored data folder is created each time the user changes the time.
The color blue is used to highlight a date in the calendar window when
time changes have been made. To view log details, select a desired date
with recorded data. Selecting the date highlighted in blue causes the
Changed Date List window to appear.


