


Cypress Envirosystems
Doc # 152-10201-01 Rev 2.0
BBS User Manual
Page 33
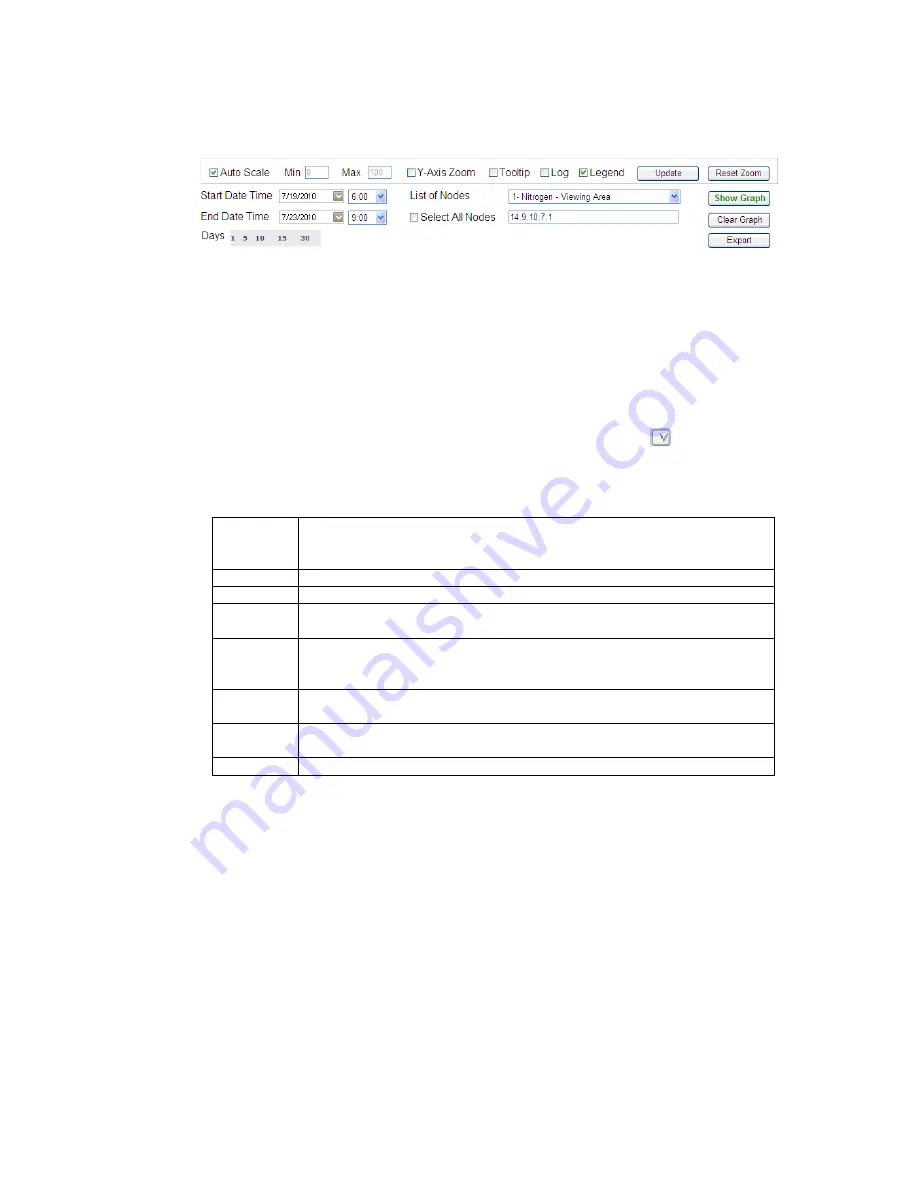
Figure 28. Graph Page dialog box
2.
In the graph dialog box, enter values for Start Date Time and End Date Time.
The format includes both date and time as m/dd/yyyy hh:mm:ss AM or PM. By default, the system
gives you the last two hours. You may also choose from 1, 5, 10, 15, and 30 days.
3.
Specify the node IDs you want to graph in the “NodeID for Graph” field
.
You can select nodes individually using the List of Nodes drop down list, enter node IDs manually, or
check the box next to Select All Nodes. For example, the nodes can be listed as 1 or 1,2,5,9 or 1-5, 9,
20. Clicking Select All Nodes will load all the nodes into the
NodeID for Graph
field.
Tip:
When selecting a node using the drop down list, click the small carrot button
next to the field to
complete the selection.
4.
Select from the following additional options:
Auto Scale
The graph will automatically scale based on values it depicts. By default, this is
selected. To turn off auto scale, uncheck the checkbox, and the “Min” and “Max”
fields will enable.
Min
If Auto Scale is turned off, the user must specify the min Y value on the graph.
Max
If Auto Scale is turned off, the user must specify the max Y value on the graph.
Y-Axis Zoom
Allows the user to zoom into data on both the x and y axis. By default zooming
occurs only on the x axis
Tooltip
This allows the user to see the actual reading value on the graph by hovering the
mouse pointer over a point on the graph. By default this option is turned off to
speed up graphing time
Legend
This is checked by default, and will display the legend in the graph. Uncheck this to
make more room for the graph.
Update
If graphing options have change, the user may click the “Update” button for the
changes to take effect on the graph
Reset Zoom
Resets the graph back to the default view (no zoom)
5.
Click Show Graph to display the graph.
A graph appears at the bottom of the page with several points that represent nodes and timestamps,
shown in Figure 29.
Tip:
If you click Clear Graph, all data in the dialog box clears, except for the nodes ID list. If you want to
delete a node, you must look up the Node ID and then go into the list and delete it manually.


