15-10
Cisco ASA Series Firewall CLI Configuration Guide
Chapter 15 Threat Detection
Monitoring Threat Detection
Evaluating Host Threat Detection Statistics
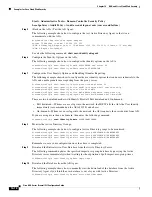
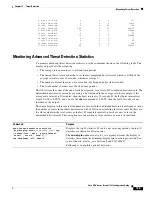
The following is sample output from the
show threat-detection statistics host
command:
hostname#
show threat-detection statistics host
Average(eps) Current(eps) Trigger Total events
Host:10.0.0.1: tot-ses:289235 act-ses:22571 fw-drop:0 insp-drop:0 null-ses:21438 bad-acc:0
1-hour Sent byte: 2938 0 0 10580308
show
threat-detection statistics
[
min-display-rate
min_display_rate
]
top
access-list
[
rate-1
|
rate-2
|
rate-3
]
To view the top 10 ACEs that match packets, including both permit and
deny ACEs, use the
access-list
keyword. Permitted and denied traffic are
not differentiated in this display. If you enable basic threat detection using
the
threat-detection basic-threat
command, you can track ACL denies
using the
show threat-detection rate acl-drop
command.
The
rate-1
keyword shows the statistics for the smallest fixed rate
intervals available in the display;
rate-2
shows the next largest rate
interval; and
rate-3
, if you have three intervals defined,
shows the largest
rate interval. For example, the display shows statistics for the last 1 hour,
8 hours, and 24 hours. If you set the
rate-1
keyword, the ASA shows only
the 1 hour time interval.
show
threat-detection statistics
[
min-display-rate
min_display_rate
]
top
host
[
rate-1
|
rate-2
|
rate-3
]
To view only host statistics, use the
host
keyword.
Note
: Due to the threat
detection algorithm, an interface used as a combination failover and state
link could appear in the top 10 hosts; this is expected behavior, and you
can ignore this IP address in the display.
show
threat-detection statistics
[
min-display-rate
min_display_rate
]
top
port-protocol
[
rate-1
|
rate-2
|
rate-3
]
To view statistics for ports and protocols, use the
port-protocol
keyword.
The
port-protocol
keyword shows statistics for both ports and protocols
(both must be enabled for the display), and shows the combined statistics
of TCP/UDP port and IP protocol types. TCP (protocol 6) and UDP
(protocol 17) are not included in the display for IP protocols; TCP and
UDP ports are, however, included in the display for ports. If you only
enable statistics for one of these types, port or protocol, then you will only
view the enabled statistics.
show
threat-detection statistics
[
min-display-rate
min_display_rate
]
top
tcp-intercept
[
all
]
detail
]]
To view TCP Intercept statistics, use the
tcp-intercept
keyword. The
display includes the top 10 protected servers under attack. The
all
keyword shows the history data of all the traced servers. The
detail
keyword shows history sampling data. The ASA samples the number of
attacks 30 times during the rate interval, so for the default 30 minute
period, statistics are collected every 60 seconds.
show
threat-detection statistics
[
min-display-rate
min_display_rate
]
host
[
ip_address
[
mask
]]
Displays statistics for all hosts or for a specific host or subnet.
show
threat-detection statistics
[
min-display-rate
min_display_rate
]
port
[
start_port
[
-
end_port
]]
Displays statistics for all ports or for a specific port or range of ports.
show
threat-detection statistics
[
min-display-rate
min_display_rate
]
protocol
[
protocol_number
|
ah
|
eigrp
|
esp
|
gre
|
icmp
|
icmp6
|
igmp
|
igrp
|
ip
|
ipinip
|
ipsec
|
nos
|
ospf
|
pcp
|
pim
|
pptp
|
snp
|
tcp
|
udp
]
Displays statistics for all IP protocols or for a specific protocol.
The
protocol_number
argument is an integer between 0 and 255.
Command
Purpose
Summary of Contents for ASA 5512-X
Page 5: ...P A R T 1 Service Policies and Access Control ...
Page 6: ......
Page 51: ...P A R T 2 Network Address Translation ...
Page 52: ......
Page 127: ...P A R T 3 Application Inspection ...
Page 128: ......
Page 255: ...P A R T 4 Connection Settings and Quality of Service ...
Page 256: ......
Page 303: ...P A R T 5 Advanced Network Protection ...
Page 304: ......
Page 339: ...P A R T 6 ASA Modules ...
Page 340: ......


