


20040801
u
[Graph] - [Scatter] (
X
)
8-7
Graphing
• In the case of a scatter graph, the first series (column or row) of selected values is used as
the
x
-values for all plots. The other selected values are used as the
y
-value for each of the
plots. This means if you select four columns of data (like Columns A, B, C, and D), for
example, there will be three different plot point types: (A, B), (A, C), and (A, D).
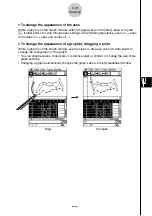
• Scatter graphs initially have plotted points only. You can add lines by selecting [Lines] on
the [View] menu.
u
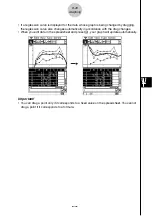
[Graph] - [Row Series]
Selecting this option treats each row as a set of data. The value in each column is plotted as
a vertical axis value. The following shows a graph of the same data as the above example,
except this time [Row Series] is selected.
Summary of Contents for Spreadsheet Application
Page 55: ...20040801 u Graph Line Clustered D u Graph Line Stacked F 8 2 Graphing ...
Page 56: ...20040801 u Graph Line 100 Stacked G u Graph Column Clustered H 8 3 Graphing ...
Page 57: ...20040801 u Graph Column Stacked J u Graph Column 100 Stacked K 8 4 Graphing ...
Page 58: ...20040801 u Graph Bar Clustered L u Graph Bar Stacked 8 5 Graphing ...
Page 74: ...CASIO COMPUTER CO LTD 6 2 Hon machi 1 chome Shibuya ku Tokyo 151 8543 Japan SA0410 B ...


