66
Step 3 • Adjusting Images
Output Brightness
Highlight
Shadow
Input Brightness
Highlight
Shadow
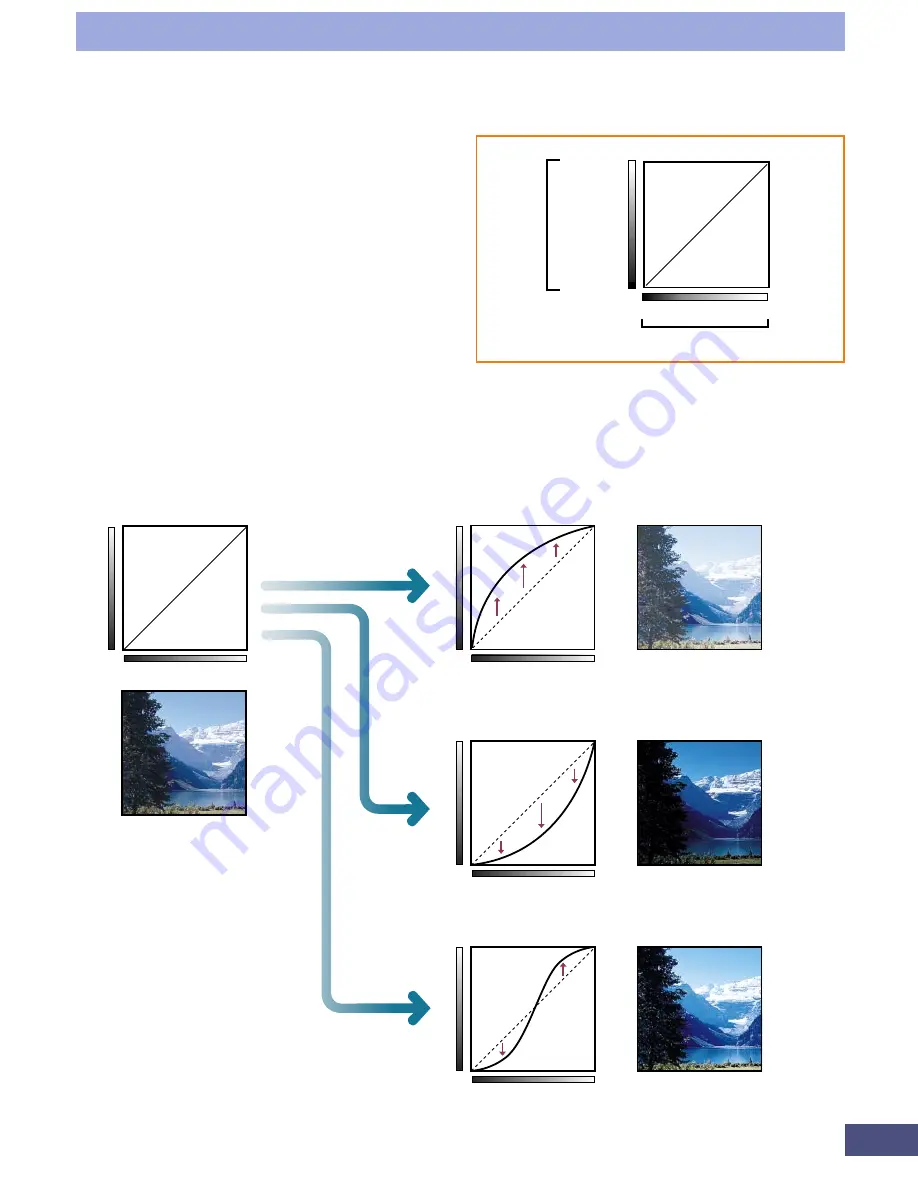
Tone Curve
Tone Curve before
Adjustment
Output
Input
Convex Curve
The input halftone data value is higher
than the output highlights, making the
image brighter in the display.
Output
Input
Concave
Curve
The input halftone data value is higher
than the output shadows, making the
image darker in the display.
Output
Input
S Curve
The input highlights and shadows are
emphasized, providing the image with a
sharp contrast.
Output
Input
* Make the curve shape as
smooth as possible to provide
a natural appearing effect.
The changes in the settings
will be reflected in the
preview image, so check the
preview image from time to
time as you make changes.
How to Interpret the Tone Curve
In CanoCraft FS, the data from the
scanner is the input and the data
sent to the display is the output.
The tone curve expresses the
relationship between the input and
output values of the color tones,
from shadows to highlights.
Adjusting a Tone Curve
The images below demonstrate how to adjust the brightness of an image by
changing the tone curve.
Summary of Contents for LEGRIA FS36
Page 10: ...Quick Start Jump Right into Scanning ...
Page 14: ...Step 1 Basic Procedures ...
Page 26: ...Step 2 Scanning ...
Page 49: ...49 Step 3 Adjusting Images ...
Page 73: ...Other Functions ...


