Section 5 ‒ Database Configuration
MLTDR-W-50S User's Guide
49
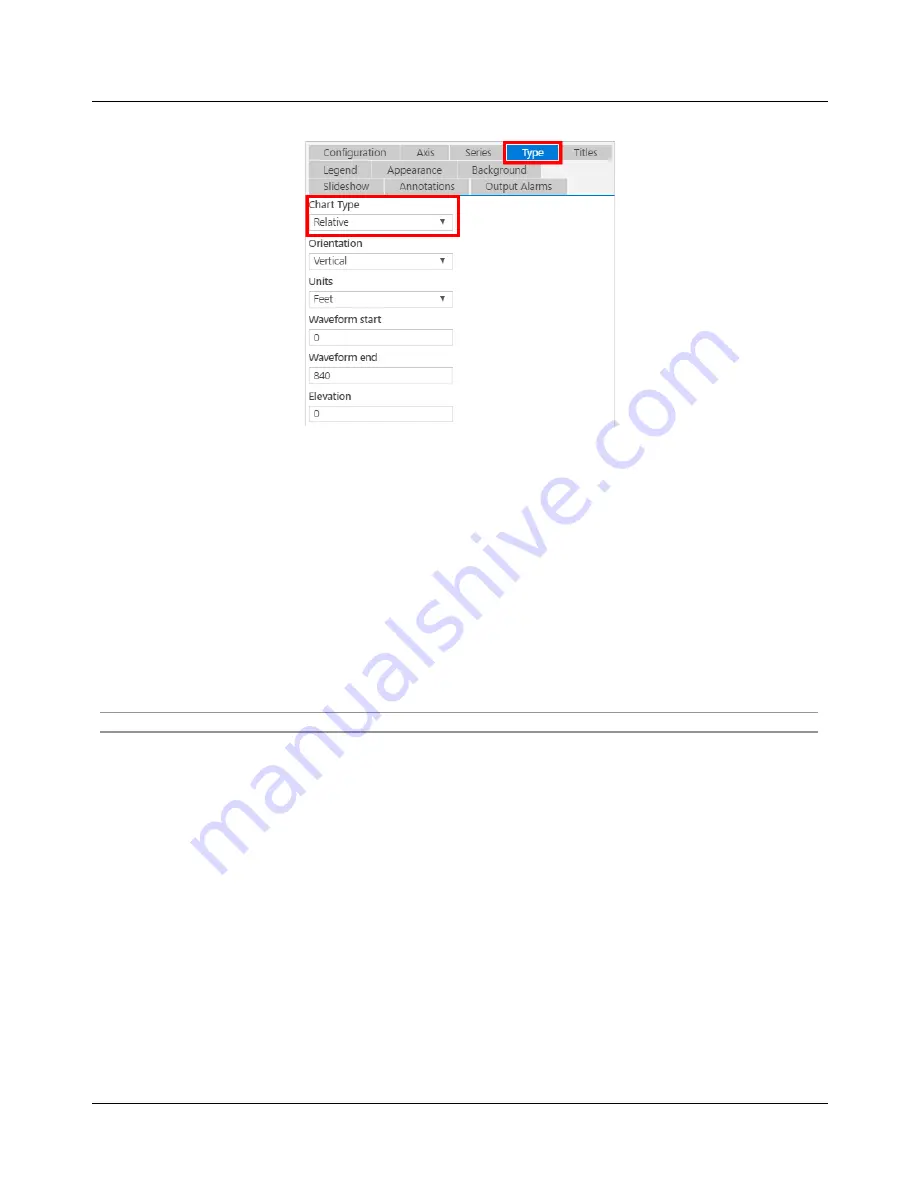
The type of TDR chart is selected from the
Chart Type
drop-down of the
Type
tab.
(Figure 5.3 G ‒ The Chart Type drop-down located in the Type tab)
The tab also has fields in which additional information about the instrument can be entered:
Orientation
– TDR data is plotted against distance, use this option to select either Horizontal (default) or
Vertical. Horizontal will plot the distance on the X-axis and the reflection coefficient data on the Y-axis, while
Vertical will plot the distance on the Y-axis and the reflection coefficient data on the X-axis. Typically, the
orientation of the cable is used to configure this option.
Units
‒ Configure the units that will be used to display TDR cable distance on the chart. The options are
Meters (default) or Feet.
Waveform Start
– Often, there is a length of cable between the reader and where it enters the embankment or
structure to be monitored. Use this edit to remove this unwanted data from the start of the data set.
Waveform End
– Use this edit to remove data from the end of the dataset that may be due to reflections from
the end of the cable, or is otherwise not useful for plotting.
Elevation
– Enter the ground elevation to adjust the depth values to reference elevation on the Y-axis.
Note
‒ The units for Waveform Start, Waveform End and Elevation must match the units configured.
See the
MLWeb User's Guide
for information on general configuration of charts and specifics on TDR charts.


