


Chapter 7: Operation
System statistics
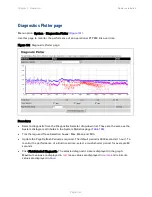
Diagnostics Plotter page
Menu option: System > Diagnostics Plotter (
).
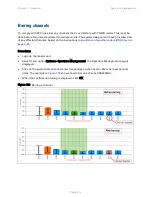
Use this page to monitor the performance of an operational PTP 650 link over time.
Figure 131 Diagnostic Plotter page
Procedure:
•
Select a diagnostic from the Diagnostics Selector drop-down list. These are the same as the
System Histogram attributes in the System Statistics page (
•
Tick the required Trace Selection boxes: Max, Mean and Min.
•
Update the Page Refresh Period as required. The default period is 3600 seconds (1 hour). To
monitor the performance of a link in real time, select a much shorter period, for example 60
seconds.
•
Click Plot Selected Diagnostic. The selected diagnostic trace is displayed in the graph.
Maximum values are displayed in
red
, mean values are displayed in
purple
and minimum
values are displayed in
blue
.
Page
7-42


