Chapter 7: Operation
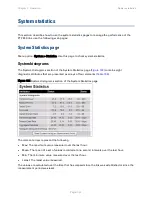
System statistics
Note
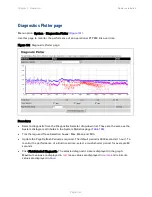
Use the
to plot these attributes against time.
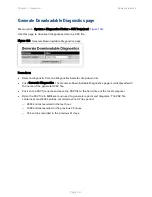
Use the
Generate Downloadable Diagnostics page
to extract historical
data for these attributes to a CSV file.
Procedure:
•
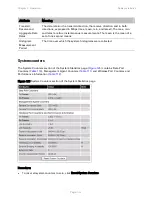
To reset and restart measurement, click Reset System Histograms and Measurement Period.
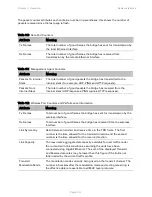
Table 109 System Histogram attributes in the System Statistics page
Attribute
Meaning
Transmit Power
The transmit power histogram, calculated over a one hour period.
Receive Power
The receive power histogram, calculated over a one hour period.
Vector Error
The vector error measurement compares (over a one hour period) the
received signal IQ modulation characteristics to an ideal signal to determine
the composite vector error magnitude.
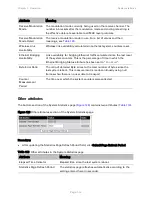
Link Loss
Link loss calculated (over a one hour period) as follows:
Peer_Tx_Power (dBm) – Local_Rx_Power (dBm) + 2 x Antenna_Pattern (dBi)
Signal Strength
Ratio
The Signal Strength Ratio (calculated over a one hour period) is:
Power received by the vertical antenna input (dB) ÷
Power received by the horizontal antenna input (dB)
This ratio is presented as: max, mean, min, and latest. The max, min and
latest are true instantaneous measurements; the mean is the mean of a set of
one second means.
Signal Strength Ratio is an aid to debugging a link. If it has a large positive or
negative value then investigate the following potential problems:
•
An antenna coaxial lead may be disconnected.
•
When spatial diversity is employed, the antenna with the lower value may
be pointing in the wrong direction.
•
When a dual polar antenna is deployed, the antenna may be directed
using a side lobe rather than the main lobe.
When there is a reflection from water on the link and spatial diversity is
employed, then one expects large, slow swings in Signal Strength Ratio
.
This indicates the antenna system is doing exactly as intended.
Page
7-33


