simple model calculated from the step track peaks of the recent few hours. A detailed
description of this function you find at chapter
'8.3.3 Smoothing'
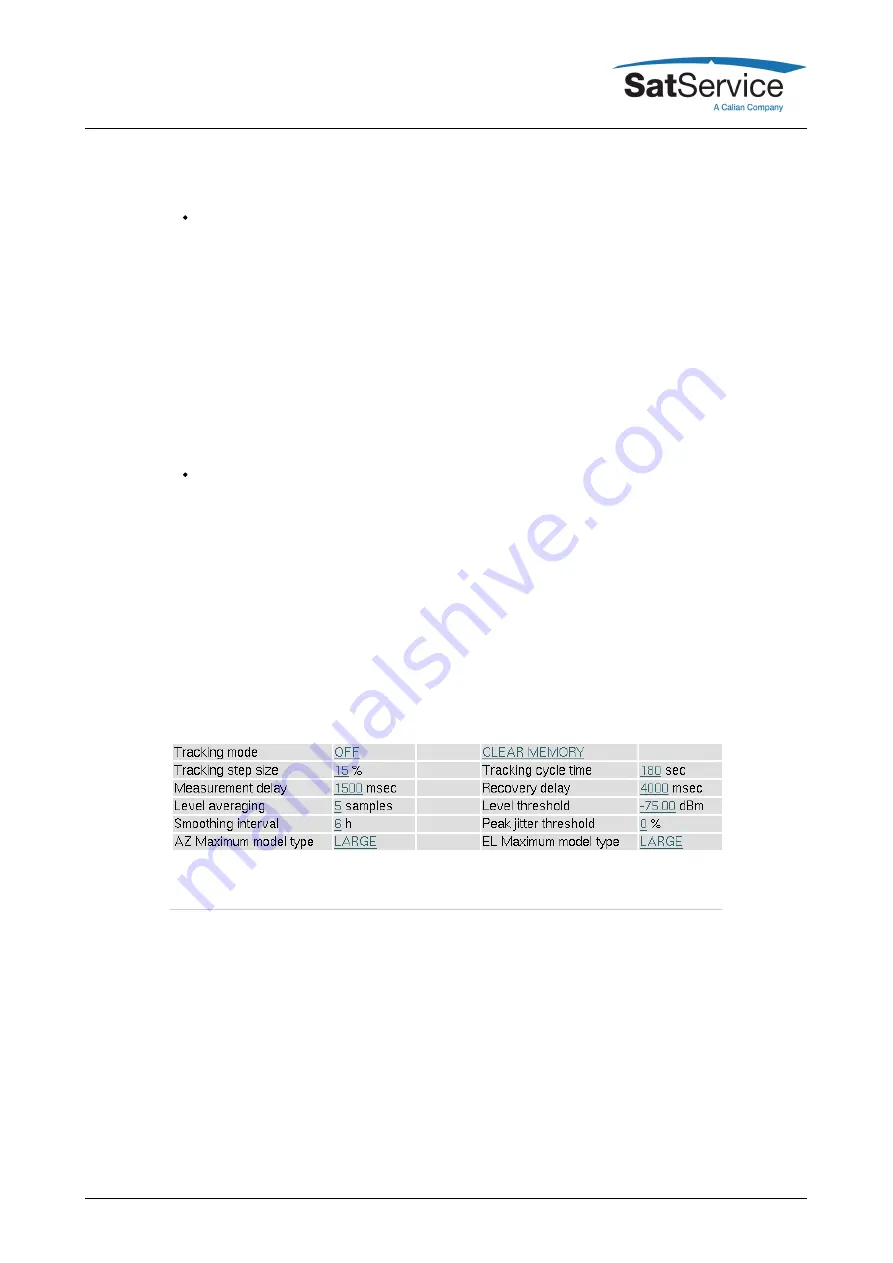
Peakjitterthreshold --- If the jitter value of at least one axis exceeds this threshold, the ACU
raises an 'model fault'. If this happens three consecutive times, the ACU resets the models of
both axes. Adaptive tracking will be possible not until 6 hours after this happens.During
adaptive tracking, the ACU evaluates for each axis a figure called jitter. The jitter value
describes standard deviation of the measured peak positions with respect to the positions
calculated from the (currently selected) model. The figure is also expressed as a percentage
of the antenna's beamwidth, low values indicate, that the model ideally describes the
antenna's path. High values indicate that's something wrong. The step track results may be
to noisy at low amplitudes or the model does not fit at all. This may be the case if a satellite
gets repositioned in the orbit.A typical threshold value is 20%, this will detect very early that
a model does not fit to describe the satellite's motion. If this value causes false alarms too
often, you may want to raise the threshold to 50%. Setting it to 0 switches the threshold
monitoring completely off.
AZMaximummodeltype ELMaximummodeltype --- These settings let you limit the
adaptive model to a simpler one, the ACU would choose by itself. The maximum model type
can be set individually for each axis. Normally you will set both axes to 'LARGE', which
leaves the model selection fully to the ACU's internal selection algorithms.In cases where the
ACU seems to be too 'optimistic' about the quality of the step track results, the maximum
model on one or both axes may be limited to a more simple and more noise-resistant model.
Specially inclined orbit satellites which are located close to the longitude of the antenna's
geodetic location may require this limitation for the azimuth axis. With such a satellite, the
elevation may move several degrees while the azimuth shows almost no motion.
Please refer to chapter
8.3 Steptrack
,
8.4 Adaptive Tracking
and
8.5 Program Tracking
for more
detailed informations about the tracking algorithms.
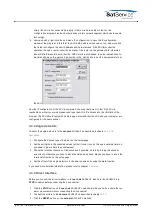
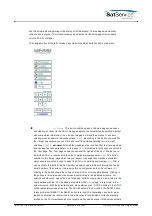
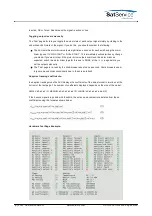
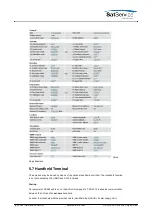
Tracking Parameters Page Example:
The page 'Test' displays the electrical / logical level of all inputs and outputs of the ACU. This
helps you to install the ACU or to identify a malfunction of peripheral components. Below some
information how to interpret the values in this page are given.
Electrical I/O Levels
The electrical state of an input or output is indicated by the HI / LO label displayed with the signal.
HI means that current is flowing through the optocoupler for this input or output. LO means that
no current flows. As some signals are defined to be 'true' when a switch is opened, the electrical
level of the signal not necessarily describes the logical level of this signal, too.
Logical I/O Levels
The logical level of an input or output is described by it's color: Green means this signal is
(C) 2022, SatService GmbH
www.satnms.com
ACU-19V2-UM-2209 Page 25/65

