P/N 140371 Rev. H
9
Banner Engineering Corp.
• Minneapolis, MN U.S.A
www.bannerengineering.com • Tel: 763.544.3164
Sure Cross® Ethernet Data Radio
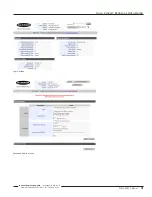
Spectrum Scanner Screen
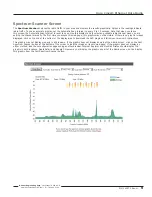
The
Spectrum Scanner
analyzes the radio traffic in your area and displays the results graphically. Spikes in the readings indicate
radio traffic. To see an accurate display, set the Automatic Scan Interval to every 3 to 10 seconds. Note that when you leave
this screen, the Automatic Scan Interval is reset to none. Use this display to help select an available radio channel when you are
setting the channel manually. The first time you access this web page, this graphic may not be visible. If there is no graphic images
displayed, click on the link at the bottom of the display area to download the SVG plugin and follow your browser’s instructions.
This graphic may not display properly in all browsers. If the graphic does not display as part of the Admin screen, click on the Fast
Spectrum Scanner button at the bottom of the screen to load the image on its own web page. If the graphic does not display by
either method, load these configuration pages using another browser. Internet Explorer and Mozilla’s Firefox should display the
graphic in both locations. Apple Safari and Google Chrome may not display the graphic as part of the Admin screen, but do display
this graphic from the Fast Spectrum Scanner button.

