


38
1.
Upper Toolbar
2.
Main Section
a)
Right column
—
displays the parameter names.
b)
Left column
—
displays the values of the parameters. When a value exceeds
the set limits, it will display red.
3.
Function Button
Display Mode
There are four types of display modes available for data viewing, which allow you to view
various types of parameters in the most suitable way.
Tap the wrench-shaped icon on the right side of the screen to open a submenu. A total of
six buttons will be displayed: The four buttons on the left represent different data display
modes, and one
Unit Change
button (for switching the unit of the displayed data), and
one
Trigger
button (
tap to open the “trigger setting” window). For more information on the
display modes, go to the
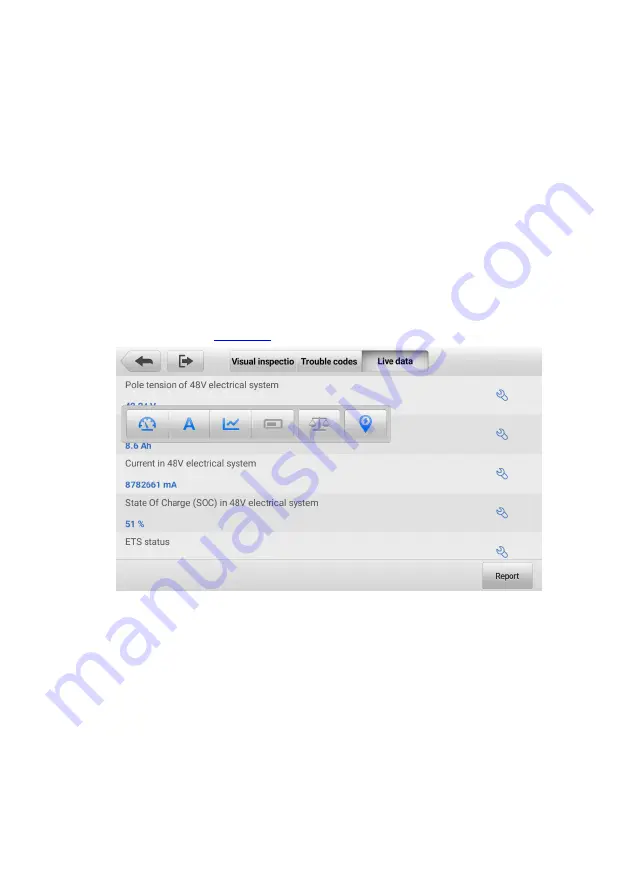
Figure 8-5
Sample Display Mode Screen
Analog Gauge Mode
—
displays the parameters in gauge charts.
Text Mode
—
the default mode that displays the parameters as a text list.
Waveform Graph Mode
—
displays the parameters in waveform graphs.
Digital Gauge Mode
—
displays the parameters in the form of a digital gauge graph.
Trigger Setting
On the trigger setting screen, you can set a standard range by filling in a Minimum value
and a Maximum value. When exceeding this range, the trigger function will be executed
and the device will automatically record and save the generated data. You can check the
saved live data by tapping the
Review
button at the bottom of the screen.