background image

EVAL-AD7403FMCZ User Guide 

UG-683 


Rev. 0 | Page 15 of 20 

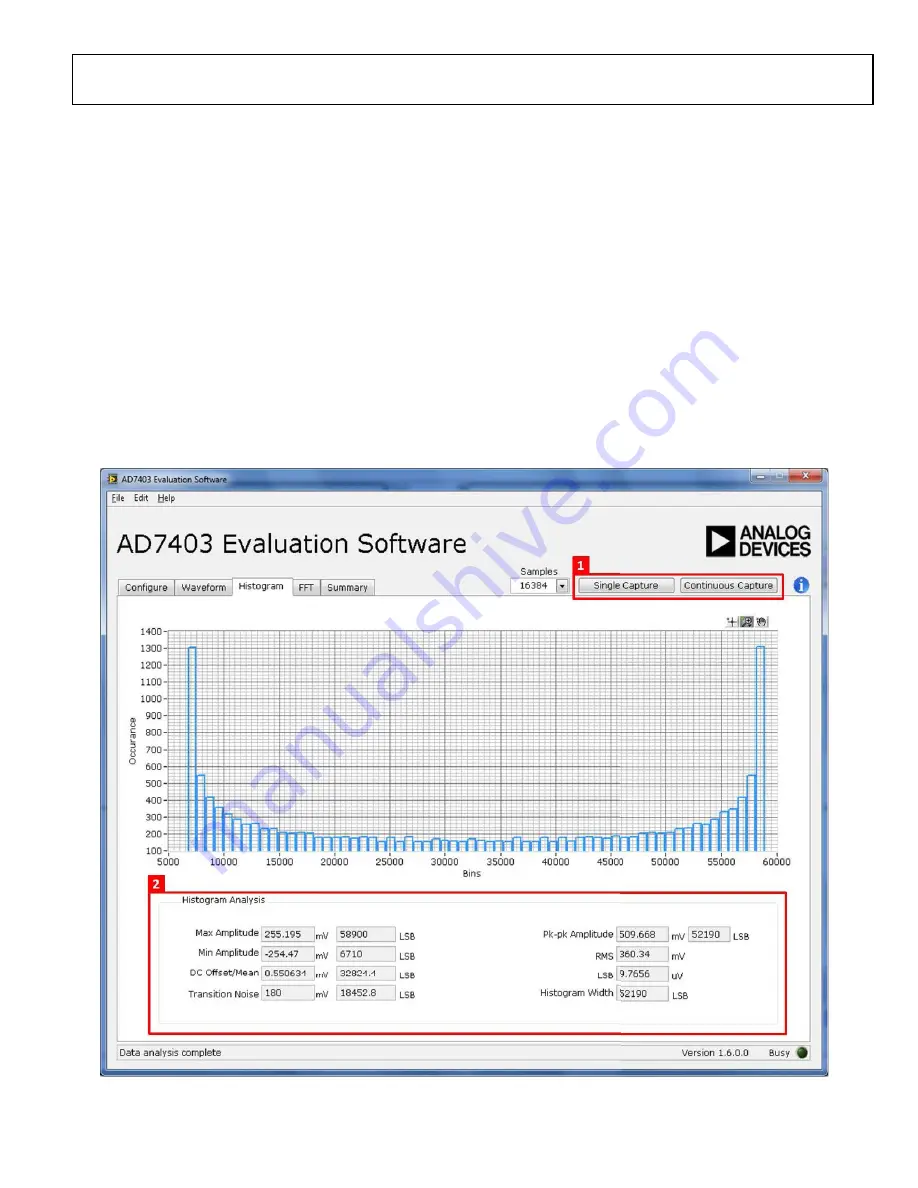
GENERATING A HISTOGRAM OF THE ADC CODE 

DISTRIBUTION 

The 

Histogram

 tab can be used to perform ac testing or, more 

commonly, dc testing. This tab shows the ADC code distribution of 
the input and computes the mean and standard deviation, which 
are displayed as 

DC Offset/Mean

 and 

Transition Noise

, respec-

tively, in the 

Histogram Analysis

 area (labeled 2 in Figure 18).  

AC Input 

To perform a histogram test of ac input,  
1.


Apply a quality signal source to the VIN+ input on the board. 

2.


Click the 

Histogram

 tab from the main window.  

3.


Click 

Single Capture 

or 

Continuous Capture

 (labeled 1 in 

Figure 18).  

Raw data is then captured and passed to the PC for statistical 
computations, and various measured values are displayed in the 

Histogram Analysis

 area (labeled 2 in Figure 18). 

DC Input 

A histogram test of dc input can be performed with or without 
an external source because the evaluation board can be 
configured with grounded inputs.  
To perform a histogram test of dc input,  
1.


If an external source is being used, apply a signal source to the 
selected analog input. It may be required to filter the signal 
to ensure that the dc source is noise-compatible with the ADC.  

2.


Click the 

Histogram

 tab from the main window.  

3.


Click 

Single Capture 

or 

Continuous Capture

 (labeled 1 in 

Figure 18).  

Raw data is then captured and passed to the PC for statistical 
computations, and various measured values are displayed in the 

Histogram Analysis

 area (labeled 2 in Figure 18). 


Figure 18. Histogram Capture Tab 


12239-

016

Summary of Contents for EVAL-AD7403FMCZ

Page 1: ...403FMCZ user guide Required Software EVAL AD7403FMCZ evaluation software FAQs and Troubleshooting GENERAL DESCRIPTION The EVAL AD7403FMCZ is a full featured evaluation board designed to allow the user to easily evaluate all features of the AD7403 isolated analog to digital converter ADC The evaluation board can be controlled by the EVAL SDP CH1Z via the FMCZ connector J9 The SDP H1 board EVAL SDP ...

Page 2: ...ut Signals 7 Link Configuration Options 9 Setup Conditions 9 Evaluation Board Circuitry 10 Sockets Connectors 10 Test Points 10 How to Use the Software 11 Starting the Software 11 Setting Up the System for Data Capture 11 Overview of the Main Window 13 Generating a Waveform Analysis Report 14 Generating a Histogram of the ADC Code Distribution 15 Generating a Fast Fourier Transform of AC Character...

Page 3: ...Connect the EVAL SDP CH1Z board to the evaluation board as shown in Figure 2 4 Connect the EVAL SDP CH1Z board to the PC via the USB cable For Windows XP you may need to search for the EVAL SDP CH1Z drivers Choose to automatically search for the drivers for the EVAL SDP CH1Z board if prompted by the operating system 5 Power up the EVAL SDP CH1Z by inserting the 12 V dc barrel jack included with th...

Page 4: ...valuation software installation CD into the CD drive of a Windows based PC and open the contents of the CD 2 Double click the setup exe file to begin the installation By default the software is saved to the following location C Program Files Analog Devices AD7403 3 A dialog box appears asking for permission to allow the program to make changes to your computer Click Yes to begin the installation p...

Page 5: ...the EVAL SDP CH1Z system demonstration platform board drivers 1 Make sure that all other applications are closed and then click Next to begin the driver installation process Figure 8 EVAL SDP CH1Z Drivers Installation Setup Wizard 2 Select the location to install the drivers and then click Install Figure 9 EVAL SDP CH1Z Drivers Installation Choose Install Location 3 Click Install to proceed with t...

Page 6: ...ply to the dc barrel connector labeled 12V_VIN on the EVAL SDP CH1Z board 4 Connect the EVAL SDP CH1Z board to the PC via the USB cable enclosed in the EVAL SDP CH1Z kit Verifying the Board Connection 1 Allow the Found New Hardware Wizard to run after the EVAL SDP CH1Z board is plugged into your PC If you are using Windows XP you may need to search for the EVAL SDP CH1Z drivers Choose to automatic...

Page 7: ... 3 V supply rails The 12 V supply is connected to the on board 5 V linear regulator that supplies the ADuM6000 with power The ADuM6000 generates an isolated 5 V supply to power the VDD1 rail of the AD7403 The 3 3 V supply rail from the EVAL SDP CH1Z is used to supply the VDD2 rail of the AD7403 If the user wishes to supply VDD1 externally an external power supply in the range of 24 V 5 can be conn...

Page 8: ...of 20 Figure 13 EVAL AD7403FMCZ Block Diagram SDP H1BOARD XILINX SPARTAN 6 FPGA ADuM6000 12V SUPPLY ADP7104 5 0 AD7403 MCLK MDAT LOW VOLTAGE VIN VIN VDD1 VDD2 A B A C ADP2241 HIGH V GND VDD1 GND B 3 3V SUPPLY VDD2 GND B A C A HIGH VOLTAGE 12239 101 ...

Page 9: ...ory Link Default Position Function Power Supplies LK1 A This link selects the AD7403 VDD1 supply source Remove LK5 if using either Position A or Position B Position A VDD1 is supplied from the ADuM6000 on board device Position B VDD1 is supplied externally via Connector J5 LK5 Removed When LK5 is inserted VDD1 is supplied via a step down dc to dc regulator via J7 Remove LK5 if VDD1 is supplied via...

Page 10: ...source J7 VDD1 external source high voltage The default interface to this evaluation board is via the FMC connector which connects the EVAL AD7403FMCZ to the EVAL SDP CH1Z board If the EVAL AD7403FMCZ board is used in standalone mode communication is achieved via the J3 and J4 SMB jacks See Table 2 for more information about configuring the evaluation board for standalone mode TEST POINTS There ar...

Page 11: ...is not connected to the USB port via the EVAL SDP CH1Z when the software is launched a connectivity error displays see Figure 14 Connect the evaluation system to the USB port of the PC and wait a few seconds and then click Rescan and follow the instructions Figure 14 Connectivity Error Alert SETTING UP THE SYSTEM FOR DATA CAPTURE After completing the steps in the Software Installation Procedures a...

Page 12: ...UG 683 EVAL AD7403FMCZ User Guide Rev 0 Page 12 of 20 Figure 15 Evaluation Software Main Window 12239 013 ...

Page 13: ...igure 15 indicates whether the EVAL AD7403FMCZ board has been detected The FPGA Settings section labeled 6 in Figure 15 specifies the MCLK frequency used for the serial interface and the decimation ratio used by the FPGA to filter the data The Samples drop down box labeled 4 in Figure 15 allows selecting the number of samples to be captured in a single acquisition Clicking Single Capture see label...

Page 14: ...e ADC and graph the resulting waveform Graph controls labeled 2 in Figure 17 are located above the graph and can be used to pan and zoom into particular areas of the graph see the Graph Tools section and Figure 16 for more information The Waveform Analysis area labeled 3 in Figure 17 shows statistics pertaining to the captured waveform such as maximum minimum and mean amplitudes and signal frequen...

Page 15: ... and passed to the PC for statistical computations and various measured values are displayed in the Histogram Analysis area labeled 2 in Figure 18 DC Input A histogram test of dc input can be performed with or without an external source because the evaluation board can be configured with grounded inputs To perform a histogram test of dc input 1 If an external source is being used apply a signal so...

Page 16: ... an appropriate band pass filter based on the sinusoidal signal applied 2 Click the FFT tab from the main window 3 Click Single Capture or Continuous Capture As in the histogram test raw data is then captured and passed to the PC which performs the FFT and displays the resulting SNR THD and SINAD Figure 19 displays the spectral analysis results of the captured data The plot is the FFT image of the...

Page 17: ... FOURIER TRANSFORM Figure 20 shows the Summary tab This tab captures and displays all of the information in one window with a synopsis of the information including key performance parameters such as SNR and THD see the SNR and THD boxes labeled 1 and 2 respectively in Figure 20 Figure 20 Summary Tab 12239 018 ...

Page 18: ...ppropriate folder location Screenshots are saved in jpeg format and can be viewed with any picture viewer editor Figure 22 Dialog Box for Saving a Screenshot PRINTING A SCREENSHOT To print a screenshot from the File menu select Print Screenshot The screenshot is sent to the default printer No dialog will appear when printing a screenshot OPENING FILES Loading Captured Data The software can load pr...

Page 19: ...EVAL AD7403FMCZ User Guide UG 683 Rev 0 Page 19 of 20 NOTES ...

Page 20: ...y other party for any reason Upon discontinuation of use of the Evaluation Board or termination of this Agreement Customer agrees to promptly return the Evaluation Board to ADI ADDITIONAL RESTRICTIONS Customer may not disassemble decompile or reverse engineer chips on the Evaluation Board Customer shall inform ADI of any occurred damages or any modifications or alterations it makes to the Evaluati...

Reviews: