


17
17
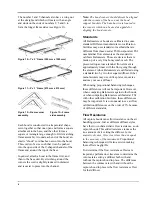
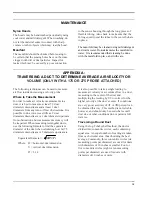
The duct in Figure 17 has a horizontal dimension
between 30 and 36 inches, requiring six points (or
six traverse lines). The duct’s vertical dimension is
less than 30 inches, requiring five points (or five
traverse lines).
Notice of Disclaimer
TSI Incorporated has made a good faith effort to
provide reliable information regarding the use of
the APM 150 to conduct a duct traverse. However,
we cannot guarantee that the material
presented
here will guarantee conformance to any particular
method or specification, or that this material is free
from error. Traverse methods outside of the USA
will be slightly different. TSI recommends
purchasing a copy of the duct traverse
specification you require from an approved
regulatory or professional organization.
For further information, refer to the 1993
ASHRAE
Fundamentals Handbook
Section 13, or to
ASHRAE Standard 111 (1988).
APPENDIX B:
TIME CONSTANT AVERAGING TECHNIQUE
The averaging technique is common to many types
of instrumentation. It also tends to increase the
display rate of the microprocessor on the LCD. In
other words, the lower the time constant value, the
higher the percentage of the new value is
displayed at an increased time rate.
This technique uses a percentage of the newly
acquired value and adds it to a percentage of the
“old” value. The two percentages must add up to
100%. The meter then displays the resultant value.
This displayed value then becomes the “old” value
while a new pressure is being measured. Then the
process starts over. By
using less than 100% of the
new value for the displayed reading, a more stable
displayed reading results. The following table
shows the [
] value and the percentages of new
and old values that will be used.
In any circumstance, if the new value is more than
50% different than the old value, 100% of the new
value will be used. This “override” percentage
allows the meter to quickly attain a new value
when the higher [
] settings are used, and
provides the desired damping to typical input
fluctuations. Without this feature, the meter would
take a long time to reach its final value when
exposed to large changes in input value.
Setting
New Value
%
Old Value
%
Time to Reach 95% of input
is less than override %
Time to reach input if
more than override %
Override
%
1
100%
0%
1.5 seconds
1.5 seconds
50%
2
50%
50%
6.0 seconds
1.5 seconds
50%
3
25%
75%
12 seconds
1.5 seconds
50%
4
10%
90%
34 seconds
1.5 seconds
50%
5
5%
95%
68 seconds
1.5 seconds
50%
Note:
The time at 1.5 seconds is the time to reach input if more than override % column corresponds to two update intervals.
Depending on when in the update cycle the stop change would occur, this is the maximum time which would be needed to see the
change. It is possible to view the change after one update.
Summary of Contents for APM 150
Page 1: ...Electronic Balometer with APM 150 Meter OWNER S MANUAL...
Page 4: ......
Page 26: ...22 22...
Page 76: ......