


94
Selecting Test Features - SONET Operation
Using Pointer Graph Test Function
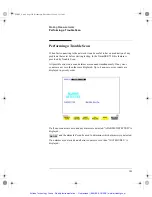
Using Pointer Graph Test Function
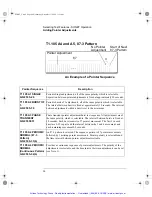
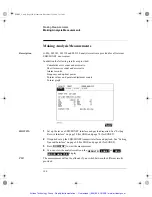
Pointer Graph shows the relative offset during the measurement period. This allows
the time relationship of SPE or VT pointer movements to be observed. Up to 4 days
of storage allows long term effects such as Wander to be observed. If an alarm
occurs during the measurement period, a new graph starts at the centre of the display
(offset zero) after recovery from the alarm.
TIP:
The Pointer Graph display can be logged to the chosen logging device. See
"Logging on Demand " page 146.
TIP:
The graph can also be viewed on the
display at the
end of the measurement.
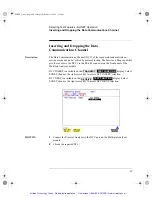
HOW TO:
1
Set up the receive SONET interface and payload as required. See “Setting
Receive Interface” page 70.
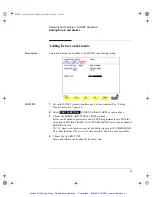
2
On the RECEIVE Test Function page, select
then choose the
CAPTURE INTERVAL required.
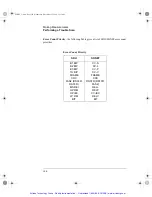
The capture interval determines the time between captures. Low values of capture
interval should be chosen when a high degree of pointer movements is expected.
High values of capture interval should be chosen when a low degree of pointer
movements is expected, for example Wander over 1 day, use 5 MINS and Wander
over 4 days, use 20 MINS.
If, during a long term measurement (4 days), an event occurs at a particular time
each day, then the instrument can be set to log the results graph of that event.
RESULTS
SONET RESULTS
PTR GRAPH
SONET_Usr.bk Page 94 Wednesday, December 13, 2000 11:11 AM
Artisan Technology Group - Quality Instrumentation ... Guaranteed | (888) 88-SOURCE | www.artisantg.com


