


134
Storing, Logging and Printing
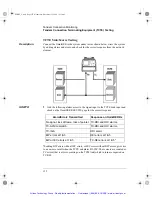
Saving Graphics Results to Instrument Store
Saving Graphics Results to Instrument Store
Description
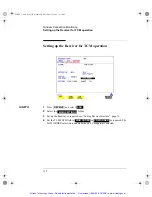
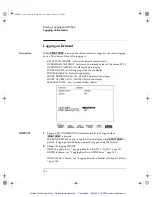
Graphical representation of measurement results is very useful particularly during a
long measurement period. It provides an overview of the results and can be printed
for record keeping.
Graphics results can be stored in instrument graph storage or on floppy disk.
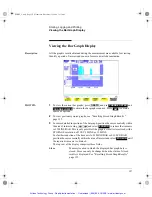
HOW TO:
1
Before starting your measurement, choose the GRAPH STORAGE resolution
and location.
The resolution chosen affects the ZOOM capability when viewing the bar graphs.
If 1 MIN is selected, 1 MIN/BAR, 15 MINS/BAR and 60 MINS/BAR are
available. If 15 MINS is selected, 15 MINS/BAR and 60 MINS/BAR are
available. If 1 HOUR is selected, 60 MINS/BAR is available.
The graphics results can be stored in the instrument - INTERNAL or stored on
DISK. Storage to disk will use a default file name unless a file name is specified
on the
display. See “Saving Graphical Results to Disk”
page 168.
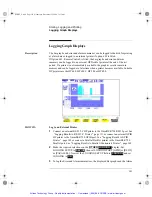
2
Press
to start the measurement. Graphical results will be stored in
the chosen location.
OTHER
FLOPPY DISK
RUN/STOP
SONET_Usr.bk Page 134 Wednesday, December 13, 2000 11:11 AM
Artisan Technology Group - Quality Instrumentation ... Guaranteed | (888) 88-SOURCE | www.artisantg.com


