


Chapter 7
7-57
Programming Examples
Measurement Data Transfer Examples
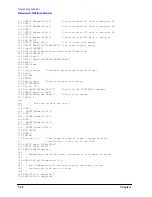
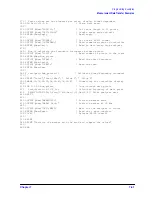
point tested, a number indicating the limit-test results, and then the upper and lower
limits at that stimulus point (if available). The number indicating the limit results is a
−
1
for no test, 0 for fail, and 1 for pass. If there are no limits available, the analyzer transmits
zeros. For this example, we delete the limit test information and keep the stimulus
information.
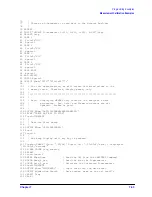
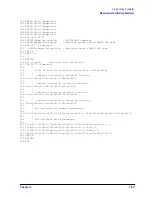
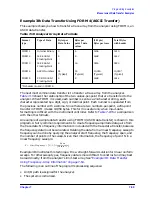
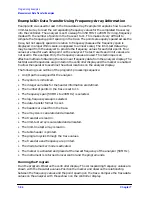
In Example 3C, the limit-test array is read into the controller and used to provide the
values directly from the analyzer memory. Reading from the limit-test array is convenient,
although it outputs the results in ASCII format (form 4), which may be slow. If there is no
other way to obtain the frequency data, this transfer time may be acceptable. Frequency
information becomes more difficult to determine when not using the linear sweep mode.
Log-frequency sweeps and list-frequency sweeps have quite different values for each data
point. For these special cases, the additional time spent reading out the limit test results is
an acceptable solution for obtaining the valid frequency information for each data point in
the trace.
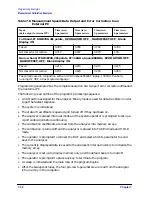
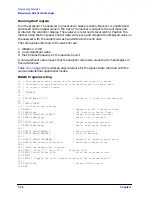
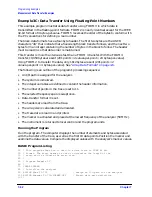
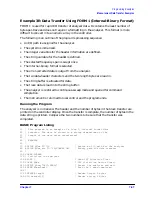
Example 3A: Data Transfer Using Markers
Markers are the simplest form of trace-data transfer. A marker may be positioned using
one of three methods:
• by a frequency location
• by an actual data point location
• by a trace-data value
In the following example, the marker is positioned on the trace's maximum value. Once
positioned on the trace, the trace data at that point can be read into the controller. The
marker data is always returned in FORM 4, ASCII format. Each number is sent as a
24-character string. Characters can be digits, signs, or decimal points. All characters
should be separated by commas. In the case of markers, three numbers are sent. The
display format determines the values of the marker responses. See
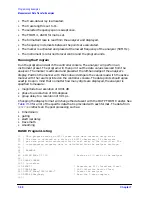
When using trace data, it is important to control the network analyzer's sweep function
(and therefore the trace data) from the computer. Using the computer to control the
instrument's sweep ensures that the data you read into the controller is in a quiescent or
steady state. It also ensures that the measurement is complete.
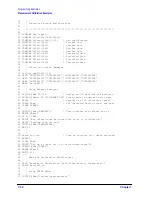
The following is an outline of the program's processing sequence:
• An I/O path is assigned for the analyzer.
• The system is initialized.
• The selected frequency span is swept once.
• The marker is activated and placed on the maximum trace value.
• The three marker values are output to the controller and displayed.
• The instrument is returned to local control and the program ends.
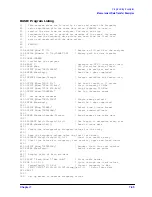
Summary of Contents for 8719ES
Page 15: ...1 1 1 Alphabetical Command Reference ...
Page 293: ...2 1 2 Introduction to Instrument Control ...
Page 310: ...3 1 3 GPIB Programming ...
Page 334: ...4 1 4 Reading Analyzer Data ...
Page 343: ...5 1 5 Data Processing Chain ...
Page 350: ...6 1 6 Error Reporting ...
Page 364: ...7 1 7 Programming Examples ...
Page 502: ...A 1 A Preset Conditions ...
Page 517: ...B 1 B Command Listings ...


