150
Realtime Trend Display
Agilaire 8872 Manual
Chapter 6 Realtime Display Programs
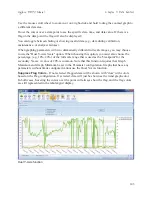
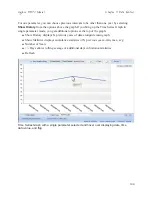
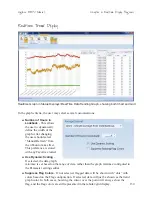
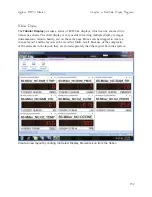
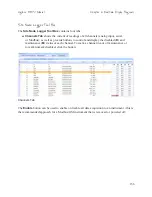
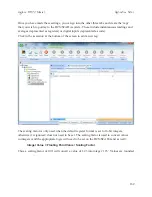
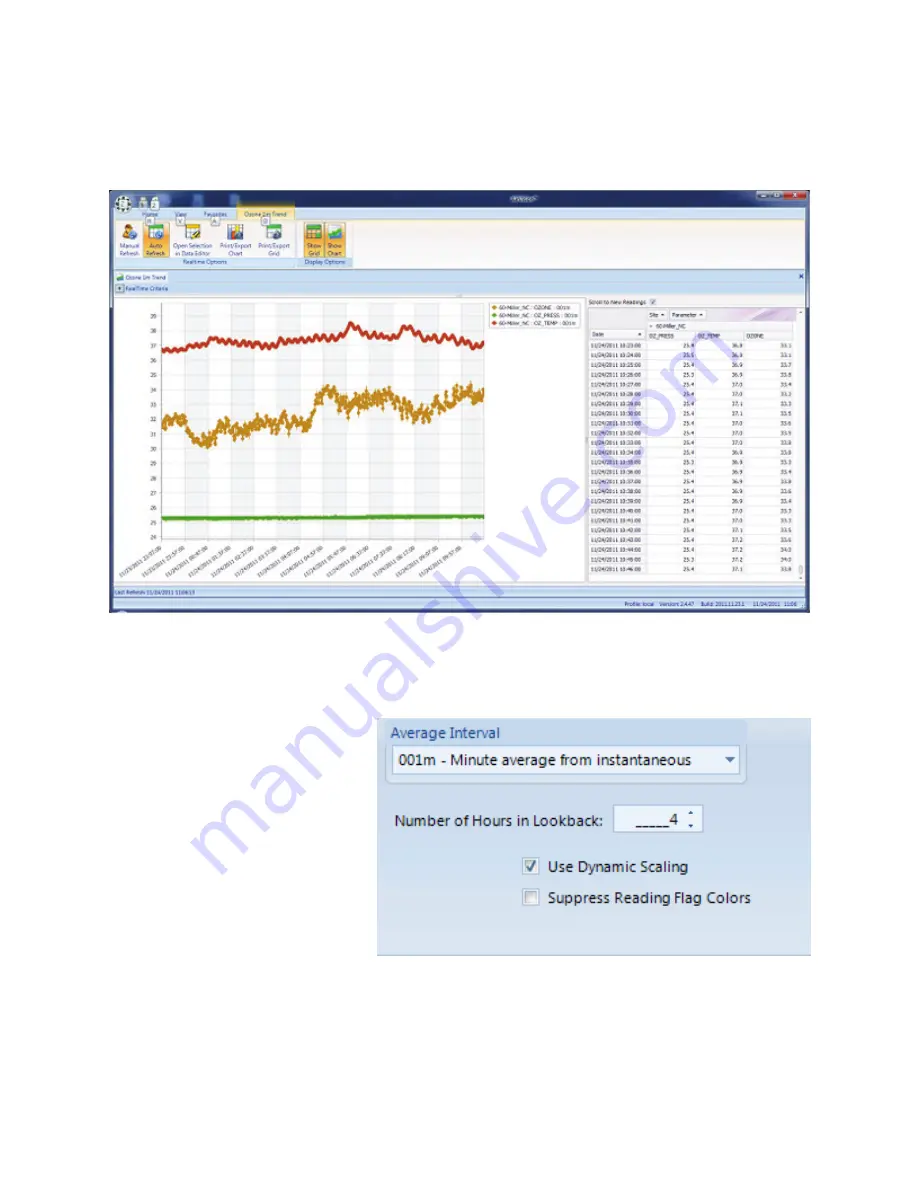
Realtime Graph in Status Displays>RealTime DataTrending Graph, showing both Chart and Grid
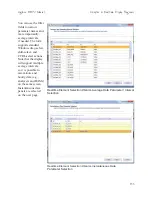
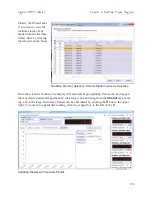
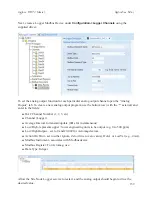
In the graph criteria, the user may select several customizations:
Number of Hours in
Lookback
- This allows
the user to dynamically
define the width of the
graph. After changing,
the user should select
“Manual Refresh” from
the ribbon to take effect.
This preference is stored
with any Favorite created.
Use Dynamic Scaling
-
If selected, the data graph
min/max is set based on the range of data, rather than the graph min/max configured in
the Parameter settings editor.
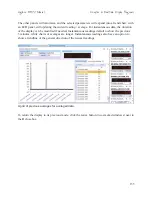
Suppress Flag Colors
- If not selected, flagged data will be shown with “dots” with
colors based on the Flag configuration. If selected, data will just be shown as the trend
graph color. In both cases, hovering the cursor over the point will always show the
flag, and the flag colors are still represented in the tabular/grid display.


