Web GUI Monitoring & Control
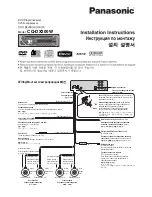
Figure 4.13: Spectrum Analyzer Window
The spectrum displayed is that of the signal present at the input to the matched (root raised
cosine) filter. This complex signal is sampled at twice the symbol rate of the demodulator, so the
extent of the frequency axis is also twice the symbol rate of the demodulator.
4.7.3.1.1
Averaging ON/Off Button
By default, the averaging function is turned on. This slows the response of the displayed spectrum
to rapid input signal changes. Turning averaging off, and then on again, will restart the
averaging process.
4.7.3.1.2
Cursors
The window in Figure 4.13 shows the spectrum display with a valid input signal. The symbol rate is
27 Mbaud, and the red and green cursors have been positioned symmetrically either side of the
local oscillator, spaced by the symbol rate.
The absolute frequencies of the red and green cursor positions are displayed in the bottom left
hand corner of the spectrum pane. The frequency spacing between the cursors (in kHz), and the
amplitude difference between the cursors (in dB) are displayed to the right. The position of the
red cursor can be moved to any other point along the frequency axis by simply clicking at the
desired point in the spectrum pane.
4.7.3.2
Signal Constellation
To select the Signal Constellation function:
Select the second icon, in the row of seven. A window, similar to that displayed in Figure 4.14is
displayed with the selected icon highlighted in blue.
4-16
SBD75e Series Demodulator Installation and Operation Manual