27
8-3-2
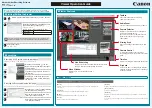
Selecting an analysis icon
Click on an icon in the Data Registration window to perform various analyses.
Note:
Click the Select box from the registration date to perform various analyses.
When the TM-2430 is used, select a maximum of two data.
Analysis menu
Menu
Refer to
Description
Select periods
8-6-1
Defines specific periods of time within an opened data
file for custom data analysis. Two periods, full analysis
and partial analysis may be defined for each data file.
Summary data
8-6-2
Displays statistical data.
Trend 8-6-3
Displays systolic blood pressure, diastolic blood
pressure, mean arterial blood pressure, pulse (heart
rate) and double product trends.
Correlation 8-6-4
Displays correlation plots of systolic blood pressure to
diastolic blood pressure, and diastolic blood pressure
to pulse.
The scatter diagram allows easy observation of the
correlation between systolic and diastolic blood
pressures; the minimum and maximum values, the
magnitude of fluctuation and the density of a 24-hour
blood pressure data.
Select periods
Summary data
Trend
Correlation
Histograms
Circadian rhythm
HBI analysis
AVERAGE trend
Ascending order
Descending order
Selection release
Print preview
Print all