

8
E
6 T
ECHNOLOGIES
, E
NTERPRISE
R
EPORTER
3.0 U
SER
’
S
G
UIDE
103
C
LIENT
U
SER
S
ECTION
: C
HAPTER
2 - A
CCESSING
THE
C
LIENT
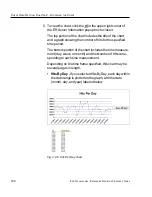
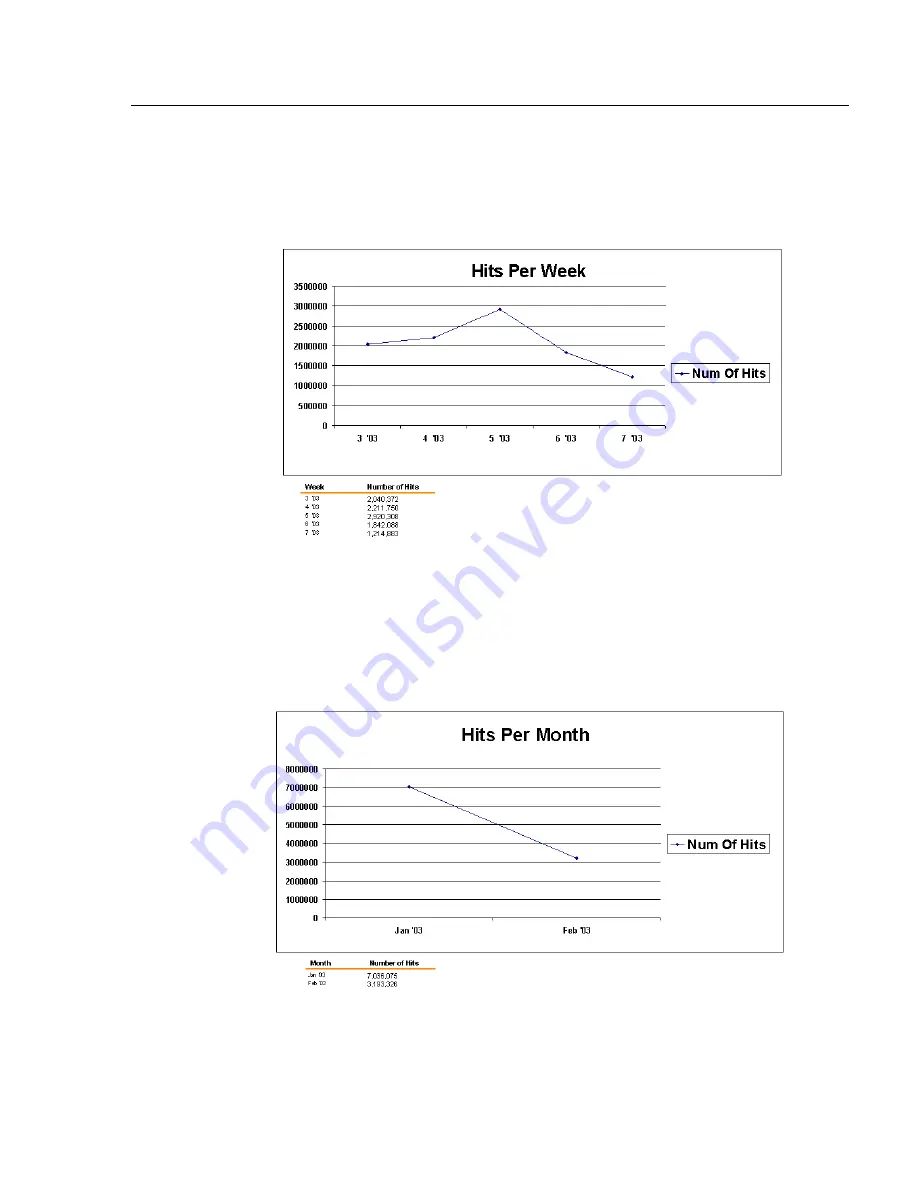
• Hits Per Week - If you selected Hits Per Week, each
week within the date range is plotted on the graph, with
the number of the week (1-52) and year labeled below.
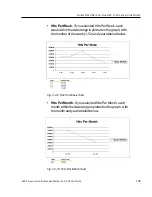
• Hits Per Month - If you selected Hits Per Month, each
month within the date range is plotted on the graph, with
the month and year labeled below.
Fig. 2:2-9 Hits Per Week chart
Fig. 2:2-10 Hits Per Month chart
Summary of Contents for 3
Page 1: ...8e6 Enterprise Reporter 3 0 USER S GUIDE ...
Page 2: ......


