52
Table View
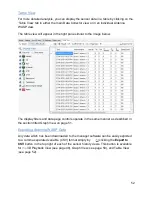
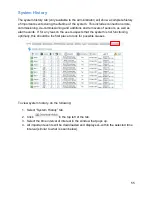
For more detailed analysis, you can display the sensor data in a table by clicking on the
‘Table View’ tab in either the main Data Collector view or in an individual Antenna
WASP view.
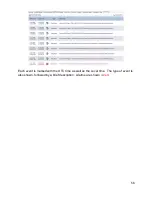
The table view will appear in the right pane similar to the image below.
The display filters and data page controls operate in the same manner as described in
the section titled Graph View
on page 51.
Exporting Antenna WASP Data
Any data which has been downloaded to the manager software can be easily exported
to a comma separated variable (CSV) format simply by
clicking the
Export to
CSV
button in the top right of each of the sensor history views. This button is available
for
(see page 49), Graph View
see page 50), and
(
see page 52).
Summary of Contents for Antenna W.A.S.P.
Page 1: ...Antenna W A S P User s Guide...
Page 5: ...5 CE Mark Conformity...
Page 59: ...59 Technical Support Contacts...

