44
o
Report
– This is the normal operating mode for the WASP remote. In this
mode, sensor information is reported once per hour.
3D View
Once you have connected to a Data Collector, as described in the section titled
Connecting to a Data Collector on page 37, you can view a 3D visualization of the
antenna WASP orientation by following these steps:
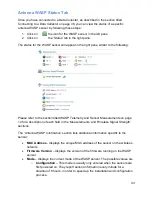
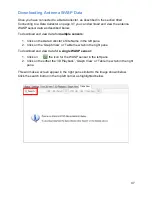
1. Click on
the icon for the WASP sensor in the left pane.
2. Click on
the ‘3D View’ tab in the right pane.
The 3D view for the WASP sensor will appear in the right pane. It will be similar to the
following:
This view renders a virtual beam (in red) to display the 3D orientation of the sensor
relative to the earth. To
compare the antenna WASP
orientation to
the target orientation
click the target icon in the top left corner. This will overlay the
ideal target orientation in green as shown below, and any discrepancy between the two
orientations will immediately become visible. If the two are perfectly aligned, the beam
lines will turn yellow.
Summary of Contents for Antenna W.A.S.P.
Page 1: ...Antenna W A S P User s Guide...
Page 5: ...5 CE Mark Conformity...
Page 59: ...59 Technical Support Contacts...


