WIENER, Plein & Baus GmbH
16
www.wiener-d.com
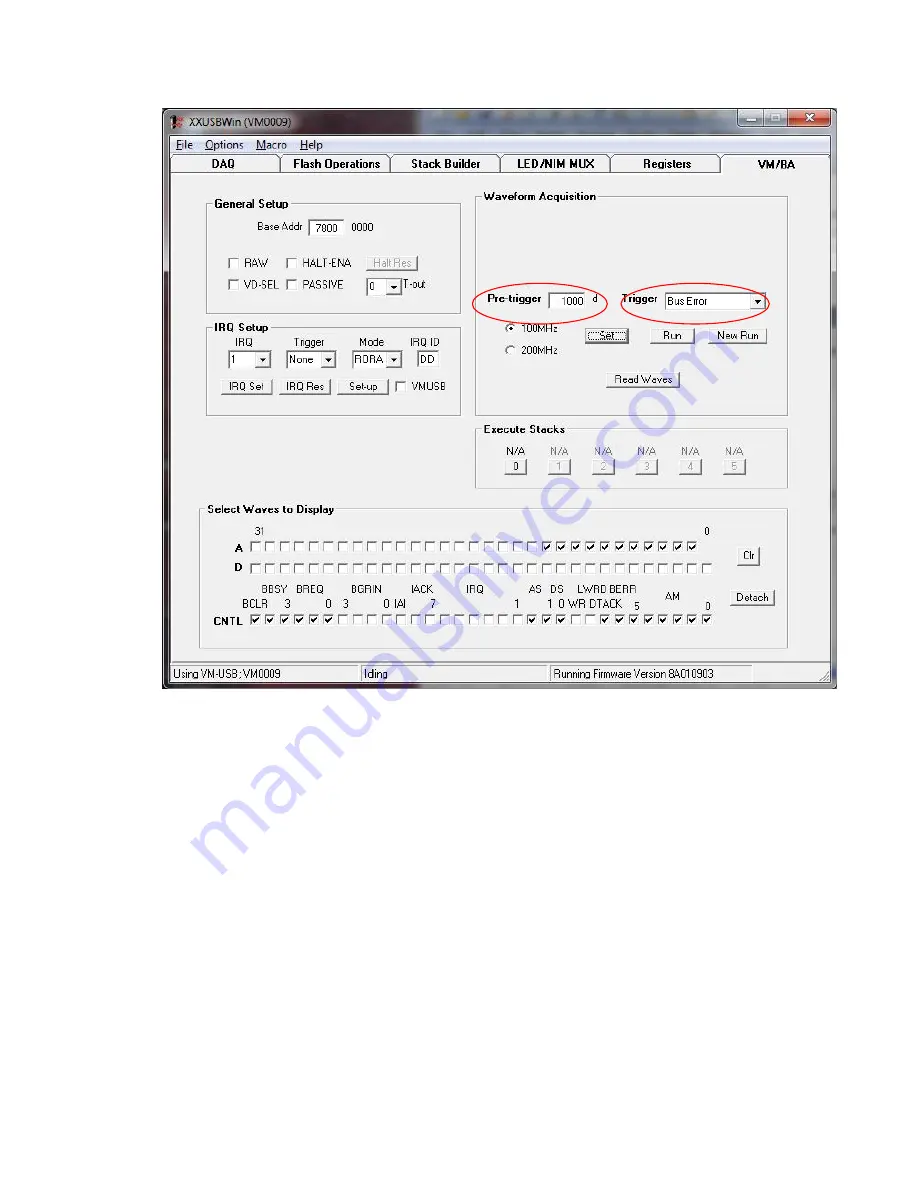
3) Click on Set to store the conditions
4) Click on Run, the red AQ LED will light up (Run will change to Halt)
5) On a bus error (red BERR will go on) the
AQ
LED will go off and the blue
F4
LED
will flash indicating that waveform data for read-out are available
6) Click on Read Waves
7) Select the lines to be shown on the waveform plot. This will open a new window
“Waveforms” showing the selected bus line waveforms. With the mouse cursor it is
possible to zoom (curser in “cross-mode”) in by selecting a range between time lines.
When pointing outside this area (“double-arrow-mode”) the displayed range can be
extended by 10 steps (left mouse click) or 100 steps (right mouse click).
The following picture shows the waveforms for a bus error BERR triggered event. See the
BERR at time = 0 (trigger, shown with dashed line) and the last VME cycles about 8µs
before the timed out which caused the bus error. The displayed lines can be changed by
checking or un-checking the related fields.


