


CHAPTER 4
• WEB INTERFACE
39
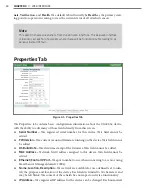
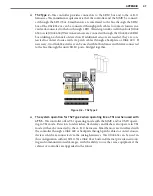
Arrival Profile
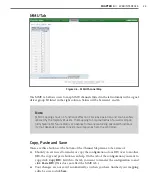
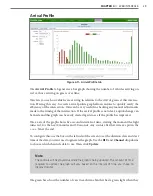
Figure 4.11 – Arrival Profile tab
The
Arrival Profile
tab generates a bar graph showing the number of vehicles arriving on
red vs. those arriving on green, over time.
This lets you see how vehicles are arriving in relation to the start of green at this intersec-
tion. Having this easy-to-create arrival profile graph allows anyone to quickly verify the
efficiency of the intersection. This can be very useful in checking any manual adjustments
made to the timing of the intersection. If the arrival profile is not ideal, a quick change can
be made and this graph can be easily created again to see if the profile has improved.
The x axis of the graph shows five-second intervals of time, starting the moment the light
turns red, for the next 2 minutes and 30 seconds. Any counts after that time are put in the
++++ bin at the end.
To configure this, use the box on the left side of the screen to set the duration, date and start
time of the data you want used to generate the graph. Use the
BIU
and
Channel
dropdowns
to choose which channel’s data to use. Then click
Update
.
Note
The controls will be grayed out while the graph is being updated. The amount of time
required to update the graph will vary based on the interval of time you chose to
display data for.
The green bars show the number of cars in each time bin that had a green light when they
Содержание Click 65 Series
Страница 1: ...Click 65x Series USER GUIDE...
Страница 2: ...Click 65x Series USER GUIDE www wavetronix com 78 East 1700 South Provo Utah 84606 801 734 7200...
Страница 5: ......
Страница 25: ......
Страница 45: ......
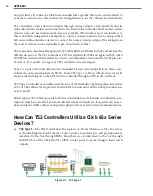
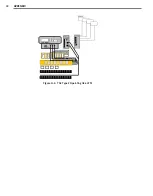
Страница 49: ...48 APPENDIX Figure A 3 TS2 Type 2 Operating like a TS1...


