background image

Using and understanding the Valgrind core: Advanced Topics

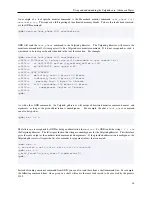
(gdb) target remote | vgdb

Remote debugging using | vgdb

no --pid= arg given and multiple valgrind pids found:

use --pid=2479 for valgrind --tool=memcheck --vgdb=yes --vgdb-error=0 ./prog

use --pid=2481 for valgrind --tool=memcheck --vgdb=yes --vgdb-error=0 ./prog

use --pid=2483 for valgrind --vgdb=yes --vgdb-error=0 ./another_prog

Remote communication error: Resource temporarily unavailable.

(gdb)

target remote | vgdb --pid=2479

Remote debugging using | vgdb --pid=2479

relaying data between gdb and process 2479

Reading symbols from /lib/ld-linux.so.2...done.

Reading symbols from /usr/lib/debug/lib/ld-2.11.2.so.debug...done.

Loaded symbols for /lib/ld-linux.so.2

[Switching to Thread 2479]

0x001f2850 in _start () from /lib/ld-linux.so.2

(gdb)

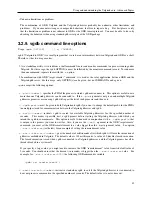
Once GDB is connected to the Valgrind gdbserver, it can be used in the same way as if you were debugging the
program natively:

• Breakpoints can be inserted or deleted.

• Variables and register values can be examined or modified.

• Signal handling can be configured (printing, ignoring).

• Execution can be controlled (continue, step, next, stepi, etc).

• Program execution can be interrupted using Control-C.

And so on. Refer to the GDB user manual for a complete description of GDB’s functionality.

3.2.4. Connecting to an Android gdbserver

When developping applications for Android, you will typically use a development system (on which the Android NDK
is installed) to compile your application. An Android target system or emulator will be used to run the application. In
this setup, Valgrind and vgdb will run on the Android system, while GDB will run on the development system. GDB
will connect to the vgdb running on the Android system using the Android NDK ’adb forward’ application.

Example: on the Android system, execute the following:

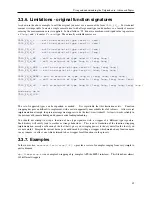
valgrind --vgdb-error=0 --vgdb=yes prog

# and then in another shell, run:

vgdb --port=1234

On the development system, execute the following commands:

34

Содержание BBV

Страница 1: ...dation with no Invariant Sections with no Front Cover Texts and with no Back Cover Texts A copy of the license is included in the section entitled The GNU Free Documentation License This is the top level of Valgrind s documentation tree The documentation is contained in six logically separate documents as listed in the following Table of Contents To get started quickly read the Valgrind Quick Star...

Страница 2: ...Valgrind Documentation Table of Contents The Valgrind Quick Start Guide 1 Valgrind User Manual 1 Valgrind FAQ 1 Valgrind Technical Documentation 1 Valgrind Distribution Documents 1 GNU Licenses 1 2 ...

Страница 3: ...The Valgrind Quick Start Guide Release 3 8 0 10 August 2012 Copyright 2000 2012 Valgrind Developers Email valgrind valgrind org ...

Страница 4: ...k Start Guide Table of Contents The Valgrind Quick Start Guide 1 1 Introduction 1 2 Preparing your program 1 3 Running your program under Memcheck 1 4 Interpreting Memcheck s output 1 5 Caveats 3 6 More information 3 ii ...

Страница 5: ...bers Using O0 is also a good idea if you can tolerate the slowdown With O1 line numbers in error messages can be inaccurate although generally speaking running Memcheck on code compiled at O1 works fairly well and the speed improvement compared to running O0 is quite significant Use of O2 and above is not recommended as Memcheck occasionally reports uninitialised value errors which don t really ex...

Страница 6: ...sage read it carefully The 19182 is the process ID it s usually unimportant The first line Invalid write tells you what kind of error it is Here the program wrote to some memory it should not have due to a heap block overrun Below the first line is a stack trace telling you where the problem occurred Stack traces can get quite large and be confusing especially if you are using the C STL Reading th...

Страница 7: ...ult Explanation of error messages from Memcheck in the Valgrind User Manual which has examples of all the error messages Memcheck produces 5 Caveats Memcheck is not perfect it occasionally produces false positives and there are mechanisms for suppressing these see Suppressing errors in the Valgrind User Manual However it is typically right 99 of the time so you should be wary of ignoring its error...

Страница 8: ...Valgrind User Manual Release 3 8 0 10 August 2012 Copyright 2000 2012 Valgrind Developers Email valgrind valgrind org ...

Страница 9: ... 1 The Client Request mechanism 29 3 2 Debugging your program using Valgrind gdbserver and GDB 31 3 2 1 Quick Start debugging in 3 steps 31 3 2 2 Valgrind gdbserver overall organisation 32 3 2 3 Connecting GDB to a Valgrind gdbserver 32 3 2 4 Connecting to an Android gdbserver 34 3 2 5 Monitor command handling by the Valgrind gdbserver 35 3 2 6 Valgrind gdbserver thread information 37 3 2 7 Examin...

Страница 10: ... 2 Using Cachegrind cg_annotate and cg_merge 77 5 2 1 Running Cachegrind 78 5 2 2 Output File 78 5 2 3 Running cg_annotate 79 5 2 4 The Output Preamble 79 5 2 5 The Global and Function level Counts 80 5 2 6 Line by line Counts 81 5 2 7 Annotating Assembly Code Programs 83 5 2 8 Forking Programs 145 5 2 9 cg_annotate Warnings 83 5 2 10 Unusual Annotation Cases 84 5 2 11 Merging Profiles with cg_mer...

Страница 11: ...ind 115 7 6 Helgrind Command line Options 118 7 7 Helgrind Client Requests 120 7 8 A To Do List for Helgrind 120 8 DRD a thread error detector 121 8 1 Overview 121 8 1 1 Multithreaded Programming Paradigms 121 8 1 2 POSIX Threads Programming Model 121 8 1 3 Multithreaded Programming Problems 122 8 1 4 Data Race Detection 122 8 2 Using DRD 123 8 2 1 DRD Command line Options 123 8 2 2 Detected Error...

Страница 12: ...s fields 151 10 2 3 Interpreting Aggregated access counts by offset data 152 10 3 DHAT Command line Options 153 11 SGCheck an experimental stack and global array overrun detector 155 11 1 Overview 155 11 2 SGCheck Command line Options 155 11 3 How SGCheck Works 155 11 4 Comparison with Memcheck 155 11 5 Limitations 156 11 6 Still To Do User visible Functionality 157 11 7 Still To Do Implementation...

Страница 13: ...mcheck can t and vice versa 9 BBV is an experimental SimPoint basic block vector generator It is useful to people doing computer architecture research and development There are also a couple of minor tools that aren t useful to most users Lackey is an example tool that illustrates some instrumentation basics and Nulgrind is the minimal Valgrind tool that does no analysis or instrumentation and is ...

Страница 14: ... although you may find it helpful to be at least a little bit familiar with what all tools do If you re new to all this you probably want to run the Memcheck tool and you might find the The Valgrind Quick Start Guide useful Be aware that the core understands some command line options and the tools have their own options which they know about This means there is no central place describing all the ...

Страница 15: ...ided by the Valgrind core As new code is executed for the first time the core hands the code to the selected tool The tool adds its own instrumentation code to this and hands the result back to the core which coordinates the continued execution of this instrumented code The amount of instrumentation code added varies widely between tools At one end of the scale Memcheck adds code to check every me...

Страница 16: ...eeping relatively small the chances of false positives or false negatives from Memcheck Also you should compile your code with Wall because it can identify some or all of the problems that Valgrind can miss at the higher optimisation levels Using Wall is also a good idea in general All other tools as far as we know are unaffected by optimisation level and for profiling tools like Cachegrind it is ...

Страница 17: ...t port of 1500 is used This default is defined by the constant VG_CLO_DEFAULT_LOGPORT in the sources Note unfortunately that you have to use an IP address here rather than a hostname Writing to a network socket is pointless if you don t have something listening at the other end We provide a simple listener program valgrind listener which accepts connections on the specified port and copies whateve...

Страница 18: ...ee if it is a duplicate If so the error is noted but no further commentary is emitted This avoids you being swamped with bazillions of duplicate error reports If you want to know how many times each error occurred run with the v option When execution finishes all the reports are printed out along with and sorted by their occurrence counts This makes it easy to see which errors have occurred most f...

Страница 19: ...pressions used by a run of valgrind tool memcheck ls l 27579 supp 1 socketcall connect serv_addr __libc_connect __nscd_getgrgid_r 27579 supp 1 socketcall connect serv_addr __libc_connect __nscd_getpwuid_r 27579 supp 6 strrchr _dl_map_object_from_fd _dl_map_object Multiple suppressions files are allowed By default Valgrind uses PREFIX lib valgrind default supp You can ask to add suppressions from a...

Страница 20: ...ns which are intended to be robust against variations in the amount of function inlining done by compilers Finally the entire suppression must be between curly braces Each brace must be the first character on its own line A suppression only suppresses an error when the error matches all the details in the suppression Here s an example __gconv_transform_ascii_internal __mbrtowc mbtowc Memcheck Valu...

Страница 21: ...ng onwards via ddd and eventually to malloc 2 6 Core Command line Options As mentioned above Valgrind s core accepts a common set of options The tools also accept tool specific options which are documented separately for each tool Valgrind s default settings succeed in giving reasonable behaviour in most cases We group the available options by rough categories 2 6 1 Tool selection Option The singl...

Страница 22: ... when using it When Valgrind skips tracing into an executable it doesn t just skip tracing that executable it also skips tracing any of that executable s child processes In other words the flag doesn t merely cause tracing to stop at the specified executables it skips tracing of entire process subtrees rooted at any of the specified executables trace children skip by arg patt1 patt2 This is the sa...

Страница 23: ...here are three special format specifiers that can be used in the file name p is replaced with the current process ID This is very useful for program that invoke multiple processes WARNING If you use trace children yes and your program invokes multiple processes OR your program forks without calling exec afterwards and you don t use this specifier or the q specifier below the Valgrind output from a...

Страница 24: ...njunction with xml yes xml file filename Specifies that Valgrind should send its XML output to the specified file It must be used in conjunction with xml yes Any p or q sequences appearing in the filename are expanded in exactly the same way as they are for log file See the description of log file for details xml socket ip address port number Specifies that Valgrind should send its XML output the ...

Страница 25: ...ce files When using Valgrind in large projects where the sources reside in multiple different directories this can be inconvenient fullpath after provides a flexible solution to this problem When this option is present the path to each source file is shown with the following all important caveat if string is found in the path then the path up to and including string is omitted else the path is sho...

Страница 26: ...ll pause after every error shown and print the line Attach to debugger Return N n Y y C c Pressing Ret or N Ret or n Ret causes Valgrind not to start a debugger for this error Pressing Y Ret or y Ret causes Valgrind to start a debugger for the program at this point When you have finished with the debugger quit from it and the program will continue Trying to continue from inside the debugger doesn ...

Страница 27: ...always fail in such situations It fails both because the debuginfo for such pre installed system components is not available anywhere and also because it would require write privileges in those directories Be careful when using dsymutil yes since it will cause pre existing dSYM directories to be silently deleted and re created Also note that dsymutil is quite slow sometimes excessively so max stac...

Страница 28: ...ind will tell you the needed max stackframe size if necessary As discussed further in the description of max stackframe a requirement for a large stack is a sign of potential portability problems You are best advised to place all large data in heap allocated memory 2 6 4 malloc related Options For tools that use their own version of malloc e g Memcheck Massif Helgrind DRD the following options app...

Страница 29: ...om file backed memory mappings Typical applications that generate code for example JITs in web browsers generate code into anonymous mmaped areas whereas the fixed code of the browser always lives in file backed mappings smc check all non file takes advantage of this observation limiting the overhead of checking to code which is likely to be JIT generated Some architectures including ppc32 ppc64 A...

Страница 30: ... changed using GDB Exposing shadow registers only works with GDB version 7 1 or later vgdb prefix prefix default tmp vgdb pipe To communicate with gdb vgdb the Valgrind gdbserver creates 3 files 2 named FIFOs and a mmap shared memory file The prefix option controls the directory and prefix for the creation of these files run libc freeres yes no default yes This option is only relevant when running...

Страница 31: ... different trade offs between fairness and performance For more details about the Valgrind thread serialisation scheme and its impact on performance and thread scheduling see Scheduling and Multi Thread Performance The value fair sched yes activates a fair scheduler In short if multiple threads are ready to run the threads will be scheduled in a round robin fashion This mechanism is not available ...

Страница 32: ...panding up the and wildcards soname synonyms syn1 pattern1 syn2 pattern2 When a shared library is loaded Valgrind checks for functions in the library that must be replaced or wrapped For example Memcheck replaces all malloc related functions malloc free calloc with its own versions Such replacements are done by default only in shared libraries whose soname matches a predefined soname pattern e g l...

Страница 33: ...ollowing entry in valgrindrc memcheck leak check yes This will be ignored if any tool other than Memcheck is run Without the memcheck part this will cause problems if you select other tools that don t understand leak check yes 2 7 Support for Threads Threaded programs are fully supported The main thing to point out with respect to threaded programs is that your program will use the native threadin...

Страница 34: ... just released the lock Sometimes the thread will be assigned to another CPU When using pipe based locking the thread that just acquired the lock will usually be scheduled on the same CPU as the thread that just released the lock With the futex based mechanism the thread that just acquired the lock will more often be scheduled on another CPU Valgrind s thread serialisation and CPU assignment by th...

Страница 35: ... itself crashes the operating system will create a core dump in the usual way 2 9 Building and Installing Valgrind We use the standard Unix configure make make install mechanism Once you have completed make install you may then want to run the regression tests with make regtest In addition to the usual prefix path to install tree there are three options which affect how Valgrind is built enable in...

Страница 36: ... 3DNow instructions If the translator encounters these Valgrind will generate a SIGILL when the instruction is executed Apart from that on x86 and amd64 essentially all instructions are supported up to and including AVX and AES in 64 bit mode and SSSE3 in 32 bit mode 32 bit mode does in fact support the bare minimum SSE4 instructions to needed to run programs on MacOSX 10 6 on 32 bit targets On pp...

Страница 37: ...ages of 80 bit numbers look correct if anyone wants to see The impression observed from many FP regression tests is that the accuracy differences aren t significant Generally speaking if a program relies on 80 bit precision there may be difficulties porting it to non x86 amd64 platforms which only support 64 bit FP precision Even on x86 amd64 the program may get different results depending on whet...

Страница 38: ...e more precisely than required by the PowerPC architecture specification All floating point operations observe the current rounding mode However fpscr FPRF is not set after each operation That could be done but would give measurable performance overheads and so far no need for it has been found As on x86 AMD64 IEEE754 exceptions are not supported all floating point exceptions are handled using the...

Страница 39: ...nalysis rerun with leak check yes The GCC folks fixed this about a week before GCC 3 0 shipped 2 13 Warning Messages You Might See Some of these only appear if you run in verbose mode enabled by v More than 100 errors detected Subsequent errors will still be recorded but in less detail than before After 100 different errors have been shown Valgrind becomes more conservative about collecting them I...

Страница 40: ...ogfile fd number Valgrind doesn t allow the client to close the logfile because you d never see any diagnostic information after that point If you see this message you may want to use the log fd number option to specify a different logfile file descriptor number Warning noted but unhandled ioctl number Valgrind observed a call to one of the vast family of ioctl system calls but did not modify its ...

Страница 41: ...e it in your client if you include a tool specific header All header files can be found in the include valgrind directory of wherever Valgrind was installed The macros in these header files have the magical property that they generate code in line which Valgrind can spot However the code does nothing when not run on Valgrind so you are not forced to run your program under Valgrind just because you...

Страница 42: ... some new memory See the comments in valgrind h for information on how to use it VALGRIND_FREELIKE_BLOCK This should be used in conjunction with VALGRIND_MALLOCLIKE_BLOCK Again see valgrind h for infor mation on how to use it VALGRIND_RESIZEINPLACE_BLOCK Informs a Valgrind tool that the size of an allocated block has been modified but not its address See valgrind h for more information on how to u...

Страница 43: ...has changed its start and end values Use this if your user level thread package implements stack growth Warning Unfortunately this client request is unreliable and best avoided 3 2 Debugging your program using Valgrind gdbserver and GDB A program running under Valgrind is not executed directly by the CPU Instead it runs on a synthetic CPU provided by Valgrind This is why a debugger cannot debug yo...

Страница 44: ... provides a built in gdbserver implementation which is activated using vgdb yes or vgdb full This gdbserver allows the process running on Valgrind s synthetic CPU to be debugged remotely GDB sends protocol query packets such as get register contents to the Valgrind embedded gdbserver The gdb server executes the queries for example it will get the register values of the synthetic CPU and gives the ...

Страница 45: ...ay application to communicate with the Valgrind embedded gdbserver gdb target remote vgdb Remote debugging using vgdb relaying data between gdb and process 2418 Reading symbols from lib ld linux so 2 done Reading symbols from usr lib debug lib ld 2 11 2 so debug done Loaded symbols for lib ld linux so 2 Switching to Thread 2418 0x001f2850 in _start from lib ld linux so 2 gdb Note that vgdb is prov...

Страница 46: ...ing the program natively Breakpoints can be inserted or deleted Variables and register values can be examined or modified Signal handling can be configured printing ignoring Execution can be controlled continue step next stepi etc Program execution can be interrupted using Control C And so on Refer to the GDB user manual for a complete description of GDB s functionality 3 2 4 Connecting to an Andr...

Страница 47: ...nd VFAT does not support pipes Possibilities you could try are data local data local Inst if you installed Valgrind there or data data name of my app if you are running a specific application and it has its own directory of that form This last possibility may have the highest probability of success You can specify the temporary directory to use either via the with tmpdir configure time flag or by ...

Страница 48: ...possibly lost 0 bytes in 0 blocks 2418 still reachable 100 bytes in 1 blocks 2418 suppressed 0 bytes in 0 blocks 2418 gdb As with other GDB commands the Valgrind gdbserver will accept abbreviated monitor command names and arguments as long as the given abbreviation is unambiguous For example the above leak_check command can also be typed as gdb mo l f r a The letters mo are recognised by GDB as be...

Страница 49: ...01f2832 in _dl_sysinfo_int80 from lib ld linux so 3 Thread 6238 tid 3 VgTs_Runnable make_error s 0x8048b76 called from London at prog c 2 Thread 6237 tid 2 VgTs_WaitSys 0x001f2832 in _dl_sysinfo_int80 from lib ld linux so 1 Thread 6234 tid 1 VgTs_Yielding main argc 1 argv 0xbedcc274 at prog c 105 gdb 3 2 7 Examining and modifying Valgrind shadow registers When the option vgdb shadow registers yes ...

Страница 50: ...rrently re instrumentation of the block currently being executed is not supported So if the action requested by GDB e g single stepping or inserting a breakpoint implies re instrumentation of the current block the GDB action may not be executed precisely This limitation applies when the basic block currently being executed has not yet been instrumented for debugging This typically happens when the...

Страница 51: ...erver watchpoints have no length limit Memcheck implements hardware watchpoint simulation by marking the watched address ranges as being unad dressable When a hardware watchpoint is removed the range is marked as addressable and defined Hardware watchpoint simulation of addressable but undefined memory zones works properly but has the undesirable side effect of marking the zone as defined when the...

Страница 52: ...being debugged Such calls are named inferior calls in the GDB terminology A typical use of an inferior call is to execute a function that prints a human readable version of a complex data structure To make an inferior call use the GDB print command followed by the function to call and its arguments As an example the following GDB command causes an inferior call to the libc printf function to be ex...

Страница 53: ...rmance degradation When ptrace is disabled in vgdb a query packet sent by GDB may take significant time to be handled by the Valgrind gdbserver In such cases GDB might encounter a protocol timeout To avoid this you can increase the value of the timeout by using the GDB command set remotetimeout Ubuntu versions 10 10 and later may restrict the scope of ptrace to the children of the process calling ...

Страница 54: ...ch processes and then exit vgdb prefix must be given to both Valgrind and vgdb if you want to change the default prefix for the FIFOs named pipes used for communication between the Valgrind gdbserver and vgdb wait number instructs vgdb to search for available Valgrind gdbservers for the specified number of seconds This makes it possible start a vgdb process before starting the Valgrind gdbserver w...

Страница 55: ... Valgrind gdbserver shared memory state d instructs vgdb to produce debugging output Give multiple d args to increase the verbosity When giving d to a relay vgdb you better redirect the standard error stderr of vgdb to a file to avoid interaction between GDB and vgdb debugging output 3 2 10 Valgrind monitor commands This section describes the Valgrind monitor commands available regardless of the V...

Страница 56: ...us shows the gdbserver status In case of problems e g of communications this shows the values of some relevant Valgrind gdbserver internal variables Note that the variables related to breakpoints and watchpoints e g the number of breakpoint addresses and the number of watchpoints will be zero as GDB by default removes all watchpoints and breakpoints when execution stops and re inserts them when re...

Страница 57: ...ents calling onwards to the original and possibly examining the result Any number of functions may be wrapped Function wrapping is useful for instrumenting an API in some way For example Helgrind wraps functions in the POSIX pthreads API so it can know about thread status changes and the core is able to wrap functions in the MPI message passing API so it can know of memory status changes associate...

Страница 58: ... arguments are handed to one of a family of macros of the form CALL_FN_ These cause Valgrind to call the original and avoid recursion back to the wrapper 3 3 2 Wrapping Specifications This scheme has the advantage of being self contained A library of wrappers can be compiled to object code in the normal way and does not rely on an external script telling Valgrind which wrappers pertain to which or...

Страница 59: ...AME_ZU NONE foo Note that the soname of an ELF object is not the same as its file name although it is often similar You can find the soname of an object libfoo so using the command readelf a libfoo so grep soname 3 3 3 Wrapping Semantics The ability for a wrapper to replace an infinite family of functions is powerful but brings complications in situations where ELF objects appear and disappear are...

Страница 60: ...s to malloc to its own implementation Indeed a replacement function can be regarded as a wrapper function which does not call the original However to make the implementation more robust the two kinds of interception wrapping vs replacement are treated differently trace redir yes shows specifications and bindings for both replacement and wrapper functions To differentiate the two replacement bindin...

Страница 61: ...ll an original of type long fn long long long long long long and so on up to CALL_FN_W_12W The set of supported types can be expanded as needed It is regrettable that this limitation exists Function wrapping has proven difficult to implement with a certain apparently unavoidable level of ickiness After several implementation attempts the present arrangement appears to be the least worst tradeoff A...

Страница 62: ...tion of error messages from Memcheck Memcheck issues a range of error messages This section presents a quick summary of what error messages mean The precise behaviour of the error checking machinery is described in Details of Memcheck s checking machinery 4 2 1 Illegal read Illegal write errors For example Invalid read of size 4 at 0x40F6BBCC within usr lib libpng so 2 1 0 9 by 0x40F6B804 within u...

Страница 63: ...itional jump or move depends on uninitialised value s at 0x402DFA94 _IO_vfprintf _itoa h 49 by 0x402E8476 _IO_printf printf c 36 by 0x8048472 main tests manuel1 c 8 An uninitialised value use error is reported when your program uses a value which hasn t been initialised in other words is undefined Here the undefined value is used somewhere inside the printf machinery of the C library This error wa...

Страница 64: ...emory state caused by the system call Here s an example of two system calls with invalid parameters include stdlib h include unistd h int main void char arr malloc 10 int arr2 malloc sizeof int write 1 stdout arr 10 exit arr2 0 You get these complaints Syscall param write buf points to uninitialised byte s at 0x25A48723 __write_nocancel in lib tls libc 2 3 3 so by 0x259AFAD3 __libc_start_main in l...

Страница 65: ... the start of a heap block 4 2 5 When a heap block is freed with an inappropriate deallocation function In the following example a block allocated with new has wrongly been deallocated with free Mismatched free delete delete at 0x40043249 free vg_clientfuncs c 171 by 0x4102BB4E QGArray QGArray void tools qgarray cpp 149 by 0x4C261C41 PptDoc PptDoc void include qmemarray h 60 by 0x4C261F0E PptXml P...

Страница 66: ... where dst is less than src For example the obvious way to implement memcpy is by copying from the first byte to the last However the optimisation guides of some architectures recommend copying from the last byte down to the first Also some implementations of memcpy zero dst before copying because zeroing the destination s cache line s can improve performance The moral of the story is if you want ...

Страница 67: ...in its output resulting in the following four categories Still reachable This covers cases 1 and 2 for the BBB blocks above A start pointer or chain of start pointers to the block is found Since the block is still pointed at the programmer could at least in principle have freed it before program exit Because these are very common and arguably not a problem Memcheck won t report such blocks individ...

Страница 68: ...including where it was allocated Actually it merges results for all blocks that have the same category and sufficiently similar stack traces into a single loss record The leak resolution lets you control the meaning of sufficiently similar It cannot tell you when or how or why the pointer to a leaked block was lost you have to work that out for yourself In general you should attempt to ensure your...

Страница 69: ...s is because such blocks don t need direct fixing by the programmer 4 3 Memcheck Command Line Options leak check no summary yes full default summary When enabled search for memory leaks when the client program finishes If set to summary it says how many leaks occurred If set to full or yes it also gives details of each individual leak show possibly lost yes no default yes When disabled the memory ...

Страница 70: ...ns quite accurately To avoid very large space and time overheads some approximations are made It is possible although unlikely that Memcheck will report an incorrect origin or not be able to identify any origin Note that the combination track origins yes and undef value errors no is nonsensical Mem check checks for and rejects this combination at startup partial loads ok yes no default no Controls...

Страница 71: ...rsions This is in violation of the 32 bit PowerPC ELF specification which makes no provision for locations below the stack pointer to be accessible ignore ranges 0xPP 0xQQ 0xRR 0xSS Any ranges listed in this option and multiple ranges can be specified separated by commas will be ignored by Memcheck s addressability checking malloc fill hexnumber Fills blocks allocated by malloc new etc but not by ...

Страница 72: ...tical to a real CPU except for one crucial detail Every bit literally of data processed stored and handled by the real CPU has in the synthetic CPU an associated valid value bit which says whether or not the accompanying bit has a legitimate value In the discussions which follow this bit is referred to as the V valid value bit Each byte in the system therefore has a 8 V bits which follow it wherev...

Страница 73: ...e and when a system call is detected Memcheck checks definedness of parameters as required If a check should detect undefinedness an error message is issued The resulting value is subsequently regarded as well defined To do otherwise would give long chains of error messages In other words once Memcheck reports an undefined value error it tries to avoid reporting further errors derived from that sa...

Страница 74: ...t them So how do the A bits get set cleared Like this When the program starts all the global data areas are marked as accessible When the program does malloc new the A bits for exactly the area allocated and not a byte more are marked as accessible Upon freeing the area the A bits are changed to indicate inaccessibility When the stack pointer register SP moves up or down A bits are set The rule is...

Страница 75: ...lised value errors one for every time the value is used There is a hazy boundary case to do with multi byte loads from addresses which are partially valid and partially invalid See details of the option partial loads ok for details Memcheck intercepts calls to malloc calloc realloc valloc memalign free new new delete and delete The behaviour you get is malloc new new the returned memory is marked ...

Страница 76: ... bits of a register can be obtained by printing the shadow 1 corresponding register In the below x86 example the register eax has all its bits undefined while the register ebx is fully defined gdb p x eaxs1 9 0xffffffff gdb p x ebxs1 10 0x0 gdb make_memory noaccess undefined defined Definedifaddressable addr len marks the range of len default 1 bytes at addr as having the given status Parameter no...

Страница 77: ...eleak specifies that only definitely leaked blocks should be shown The value possibleleak will also show possibly leaked blocks those for which only an interior pointer was found The value reachable will show all block categories reachable possibly leaked definitely leaked The third argument controls what kinds of changes are shown for a full leak search The value increased specifies that only blo...

Страница 78: ...dentified in the leak search result by a loss record number The block_list command shows the loss record information followed by the addresses and sizes of the blocks which have been merged in the loss record If a directly lost block causes some other blocks to be indirectly lost the block_list command will also show these indirectly lost blocks The indirectly lost blocks will be indented accordin...

Страница 79: ...2 of 7 19552 at 0x40070B4 malloc vg_replace_malloc c 263 19552 by 0x80484D5 mk leak tree c 28 19552 by 0x8048519 f leak tree c 43 19552 by 0x8048856 main leak tree c 63 19552 0x40280A8 16 19552 0x4028168 16 indirect loss record 5 19552 0x40281A8 16 indirect loss record 6 gdb who_points_at addr len shows all the locations where a pointer to addr is found If len is equal to 1 the command only shows ...

Страница 80: ...sable VALGRIND_CHECK_MEM_IS_ADDRESSABLE and VALGRIND_CHECK_MEM_IS_DEFINED check immedi ately whether or not the given address range has the relevant property and if not print an error message Also for the convenience of the client returns zero if the relevant property holds otherwise the returned value is the address of the first byte for which the property is not true Always returns 0 when not ru...

Страница 81: ...stop reporting errors in terms of the block named by VALGRIND_CREATE_BLOCK To make this possible VALGRIND_CREATE_BLOCK returns a block handle which is a C int value You can pass this block handle to VALGRIND_DISCARD After doing so Valgrind will no longer relate addressing errors in the specified range to the block Passing invalid handles to VALGRIND_DISCARD is harmless 4 8 Memory Pools describing ...

Страница 82: ...re NOACCESS To maintain this invariant the client program must ensure that the superblock starts out in that state Memcheck cannot make it so since Memcheck never explicitly learns about the superblock of a pool only the allocated chunks within the pool Once the header and superblock for a pool are established and properly marked there are a number of client requests programs can use to inform Mem...

Страница 83: ...r addr size 1 areas outside the intersection are marked as NOACCESS as though they had been independently freed with VALGRIND_MEMPOOL_FREE This is a somewhat rare request but can be useful in implementing the type of mass free operations common in custom LIFO allocators VALGRIND_MOVE_MEMPOOL poolA poolB This request informs Memcheck that the pool previously anchored at address poolA has moved to a...

Страница 84: ...e Valgrind s configure script will look for a suitable mpicc to build it with This must be the same mpicc you use to build the MPI application you want to debug By default Valgrind tries mpicc but you can specify a different one by using the configure time option with mpicc Currently the wrappers are only buildable with mpiccs which are based on GNU GCC or Intel s C Compiler Check that the configu...

Страница 85: ...artup The default behaviour is to print a starting banner valgrind MPI wrappers 16386 Active for pid 16386 valgrind MPI wrappers 16386 Try MPIWRAP_DEBUG help for possible options and then be relatively quiet You can give a list of comma separated options in MPIWRAP_DEBUG These are verbose show entries exits of all wrappers Also show extra debugging info such as the status of outstanding MPI_Reques...

Страница 86: ...nd PMPI_Bsend PMPI_Ssend PMPI_Rsend PMPI_Recv PMPI_Get_count PMPI_Isend PMPI_Ibsend PMPI_Issend PMPI_Irsend PMPI_Irecv PMPI_Wait PMPI_Waitall PMPI_Test PMPI_Testall PMPI_Iprobe PMPI_Probe PMPI_Cancel PMPI_Sendrecv PMPI_Type_commit PMPI_Type_free PMPI_Pack PMPI_Unpack PMPI_Bcast PMPI_Gather PMPI_Scatter PMPI_Alltoall PMPI_Reduce PMPI_Allreduce PMPI_Op_create PMPI_Comm_create PMPI_Comm_dup PMPI_Comm...

Страница 87: ...buffer and returns immediately giving a handle MPI_Request for the transaction Later the user will have to poll for completion with MPI_Wait etc and when the transaction completes successfully the wrappers have to paint the recv buffer But the recv buffer details are not presented to MPI_Wait only the handle is The library therefore maintains a shadow table which associates uncompleted MPI_Request...

Страница 88: ...central point which uses the specified reduction function to merge the data items into a single item Hence in general data is passed between nodes and fed to the reduction function but the wrapper library cannot mark the transferred data as initialised before it is handed to the reduction function because all that happens inside the PMPI_Reduce call As a result you may see false positives reported...

Страница 89: ...he reads Ir which equals the number of instructions executed I1 cache read misses I1mr and LL cache instruction read misses ILmr D cache reads Dr which equals the number of memory reads D1 cache read misses D1mr and LL cache data read misses DLmr D cache writes Dw which equals the number of memory writes D1 cache write misses D1mw and LL cache data write misses DLmw Conditional branches executed B...

Страница 90: ...430 290 10 955 517 rd 4 474 773 wr 31751 D1 misses 41 185 21 905 rd 19 280 wr 31751 LLd misses 23 085 3 987 rd 19 098 wr 31751 D1 miss rate 0 2 0 1 0 4 31751 LLd miss rate 0 1 0 0 0 4 31751 31751 LL misses 23 360 4 262 rd 19 098 wr 31751 LL miss rate 0 0 0 0 0 4 Cache accesses for instruction fetches are summarised first giving the number of fetches made this is the number of instructions executed...

Страница 91: ...as the output lines can be quite long To get a function by function summary run cg_annotate filename on a Cachegrind output file 5 2 4 The Output Preamble The first part of the output looks like this I1 cache 65536 B 64 B 2 way associative D1 cache 65536 B 64 B 2 way associative LL cache 262144 B 64 B 8 way associative Command concord vg_to_ucode c Events recorded Ir I1mr ILmr Dr D1mr DLmr Dw D1mw...

Страница 92: ...ow counts to avoid drowning you in information In this case cg_annotate shows summaries the functions that account for 99 of the Ir counts Ir is chosen as the threshold event since it is the primary sort event The threshold can be adjusted with the threshold option Chosen for annotation names of files specified manually for annotation in this case none Auto annotation whether auto annotation was r...

Страница 93: ...1 1 1 concord c create 149 518 0 0 149 516 0 0 1 0 0 tolower GLIBC_2 0 149 518 0 0 149 516 0 0 1 0 0 fgetc GLIBC_2 0 95 983 4 4 38 031 0 0 34 409 3 152 3 150 concord c new_word_node 85 440 0 0 42 720 0 0 21 360 0 0 vg_clientmalloc c vg_bogus_epilogue Each function is identified by a file_name function_name pair If a column contains only a dot it means the function never performs that event e g the...

Страница 94: ...2 0 0 free data 4 0 0 1 0 0 2 0 0 fclose file_ptr 3 0 0 2 0 0 Although column widths are automatically minimised a wide terminal is clearly useful Each source file is clearly marked User annotated source as having been chosen manually for annotation If the file was found in one of the directories specified with the I include option the directory and file are both given Each line is annotated with ...

Страница 95: ...the debugging information aren t specific enough Beware that cg_annotate can take some time to digest large cachegrind out pid files e g 30 seconds or more Also beware that auto annotation can produce a lot of output if your program is large 5 2 7 Annotating Assembly Code Programs Valgrind can annotate assembly code programs too or annotate the assembly code generated for your C program Sometimes ...

Страница 96: ...8078b08 eax 8048f39 89 45 f0 mov eax 0xfffffff0 ebp Notice the extra mov esi esi instruction Where did this come from The GNU assembler inserted it to serve as the two bytes of padding needed to align the movl LnrB eax instruction on a four byte boundary but pretended it didn t exist when adding debug information Thus when Valgrind reads the debug info it thinks that the movl 0x1 0xffffffec ebp in...

Страница 97: ...ether profile files from completely unrelated programs It does however check that the Events lines of all the inputs are identical so as to ensure that the addition of costs makes sense For example it would be nonsensical for it to add a number indicating D1 read references to a number from a different file indicating LL write misses A number of other syntax and sanity checks are done whilst readi...

Страница 98: ...f for the second version When this happens you can use the mod filename option Its argument is a Perl search and replace expression that will be applied to all the filenames in both Cachegrind output files It can be used to remove minor differences in filenames For example the option mod filename s version 0 9 versionN will suffice for this case Similarly sometimes compilers auto generate certain ...

Страница 99: ...old X default 0 1 Sets the threshold for the function by function summary A function is shown if it accounts for more than X of the counts for the primary sort event If auto annotating also affects which files are annotated Note thresholds can be set for more than one of the events by appending any events for the sort option with a colon and a number no spaces though E g if you want to see each fu...

Страница 100: ...However if you look at the line by line annotations for f you ll see the counts that belong to f This is hard to avoid it s how the debug info is structured So it s worth looking for large numbers in the line by line annotations The line by line source code annotations are much more useful In our experience the best place to start is by looking at the Ir numbers They simply measure how many instru...

Страница 101: ...lly replicates all the entries of the L1 caches because fetching into L1 involves fetching into LL first this does not guarantee strict inclusiveness as lines evicted from LL still could reside in L1 This is standard on Pentium chips but AMD Opterons Athlons and Durons use an exclusive LL cache that only holds blocks evicted from L1 Ditto most modern VIA CPUs The cache configuration simulated cach...

Страница 102: ...own history and the behaviour of previous branches This is a standard technique for improving prediction accuracy For indirect branches that is jumps to unknown destinations Cachegrind uses a simple branch target address predictor Targets are predicted using an array of 512 entries indexed by the low order 9 bits of the branch instruction s address Each branch is predicted to jump to the same addr...

Страница 103: ...ations will be small but don t expect perfectly repeatable results if your program changes at all More recent GNU Linux distributions do address space randomisation in which identical runs of the same program have their shared libraries loaded at different locations as a security measure This also perturbs the results While these factors mean you shouldn t trust the results to be super accurate th...

Страница 104: ...e line of info can be presented for each file fn line number In such cases the counts for the named events will be accumulated Counts can be to represent zero This makes the files easier for humans to read The number of counts in each line and the summary_line should not exceed the number of events in the event_line If the number in each line is less cg_annotate treats those missing as though they...

Страница 105: ...nt counts data reads cache misses etc are attributed directly to the function they occurred in This cost attribution mechanism is called self or exclusive attribution Callgrind extends this functionality by propagating costs across function call boundaries If function foo calls bar the costs from bar are added into foo s costs When applied to the program as a whole this builds up a picture of so c...

Страница 106: ...gram among the functions executed together with Instruction Read Ir event counts To generate a function by function summary from the profile data file use callgrind_annotate options callgrind out pid This summary is similar to the output you get from a Cachegrind run with cg_annotate the list of functions is ordered by exclusive cost of functions which also are the ones that are shown Important fo...

Страница 107: ...to see assembly code level annotation specify dump instr yes This will produce profile data at instruction granularity Note that the resulting profile data can only be viewed with KCachegrind For assembly annotation it also is interesting to see more details of the control flow inside of functions i e conditional jumps This will be collected by further specifying collect jumps yes 6 2 Advanced Usa...

Страница 108: ...methods will only generate one dump of the currently running thread With the other methods you will get multiple dumps one for each thread on a dump request 6 2 2 Limiting the range of collected events For aggregating events function enter leave instruction execution memory access into event numbers first the events must be recognizable by Callgrind and second the collection state must be enabled ...

Страница 109: ...sts for calls inside of a cycle are meaningless The definition of inclusive cost i e self cost of a function plus inclusive cost of its callees needs a topological order among functions For cycles this does not hold true callees of a function in a cycle include the function itself Therefore KCachegrind does cycle detection and skips visualization of any inclusive cost for calls inside of cycles Fu...

Страница 110: ...to get a 2 caller dependency for all functions Note that doing this will increase the size of profile data files 6 2 5 Forking Programs If your program forks the child will inherit all the profiling data that has been gathered for the parent To start with empty profile counter values in the child the client request CALLGRIND_ZERO_STATS can be inserted into code to be executed by the child directly...

Страница 111: ...e data It specifies whether numerical positions are always specified as absolute values or are allowed to be relative to previous numbers This shrinks the file size combine dumps no yes default no When enabled when multiple profile data parts are to be generated these parts are appended to the same output file Not recommended 6 3 2 Activity options These options specify when actions relating to ev...

Страница 112: ...s needed to only see event counters happening while inside of the program part you want to profile The second option can be used if the program part you want to profile is called many times Option 1 i e creating a lot of dumps is not practical here Collection state can be toggled at entry and exit of a given function with the option toggle collect If you use this option collection state should be ...

Страница 113: ...nly see A C This is very convenient to skip functions handling callback behaviour For example with the signal slot mechanism in the Qt graphics library you only want to see the function emitting a signal to call the slots connected to that signal First determine the real call chain to see the functions needed to be skipped then use this option 6 3 5 Simulation options cache sim yes no default no S...

Страница 114: ...at the reason i e the code with the bad access behavior The new counters are defined in a way such that worse behavior results in higher cost AcCost1 and AcCost2 are counters showing bad temporal locality for L1 and LL caches respectively This is done by summing up reciprocal values of the numbers of accesses of each cache line multiplied by 1000 as only integer costs are allowed E g for a given s...

Страница 115: ...s collect atstart and toggle collect CALLGRIND_START_INSTRUMENTATION Start full Callgrind instrumentation if not already enabled When cache simulation is done this will flush the simulated cache and lead to an artifical cache warmup phase afterwards with cache misses which would not have happened in reality See also option instr atstart CALLGRIND_STOP_INSTRUMENTATION Stop full Callgrind instrument...

Страница 116: ...llgrind_control l long Show also the working directory in addition to the brief information given by default s stat Show statistics information about active Callgrind runs b back Show stack back traces of each thread in active Callgrind runs For each active function in the stack trace also the number of invocations since program start or last dump is shown This option can be combined with e to sho...

Страница 117: ...is is useful to skip uninteresting program parts as there is much less slowdown same as with the Valgrind tool none See also the Callgrind option instr atstart w dir Specify the startup directory of an active Callgrind run On some systems active Callgrind runs can not be detected To be able to control these the failed auto detection can be worked around by specifying the directory where a Callgrin...

Страница 118: ...ons and tracks their effects as accurately as it can On x86 and amd64 platforms it understands and partially handles implicit locking arising from the use of the LOCK instruction prefix On PowerPC POWER and ARM platforms it partially handles implicit locking arising from load linked and store conditional instruction pairs Helgrind works best when your application uses only the POSIX pthreads API H...

Страница 119: ...g to the validity of mutexes are generally also performed for reader writer locks Various kinds of this can t possibly happen events are also reported These usually indicate bugs in the system threading library Reported errors always contain a primary stack trace indicating where the error was detected They may also contain auxiliary stack traces giving additional information In particular most er...

Страница 120: ...a cycle indicates a potential deadlock involving the locks in the cycle In general Helgrind will choose two locks involved in the cycle and show you how their acquisition ordering has become inconsistent It does this by showing the program points that first defined the ordering and the program points which later violated it Here is a simple example involving just two locks Thread 1 lock order 0x7F...

Страница 121: ...f the central difficulties of threaded programming Reliably detecting races is a difficult problem and most of Helgrind s internals are devoted to dealing with it We begin with a simple example 7 4 1 A Simple Data Race About the simplest possible example of a race is as follows In this program it is impossible to know what the value of var is at the end of the program Is it 2 Or 1 include pthread ...

Страница 122: ...me location in such a way that the result depends on the relative speeds of the two threads The first stack trace follows the text Possible data race during read of size 4 and the second trace follows the text This conflicts with a previous write of size 4 Hel grind is usually able to show both accesses involved in a race At least one of these will be a write since two concurrent unsynchronised re...

Страница 123: ...rent thread Child thread int var create child thread pthread_create var 20 var 10 exit wait for child pthread_join printf d n var The parent thread creates a child Both then write different values to some variable var and the parent then waits for the child to exit What is the value of var at the end of the program 10 or 20 We don t know The program is considered buggy it has a race because the fi...

Страница 124: ...e happens before relation creates only a partial ordering not a total ordering An example of a total ordering is comparison of numbers for any two numbers x and y either x is less than equal to or greater than y A partial ordering is like a total ordering but it can also express the concept that two elements are neither equal less or greater but merely unordered with respect to each other In the f...

Страница 125: ... creating the child are regarded as happening before all the accesses of the child Similarly when an exiting thread is reaped via a call to pthread_join once the call returns the reaping thread acquires a happens after dependency relative to all memory accesses made by the exiting thread In summary Helgrind intercepts the above listed events and builds a directed acyclic graph represented the coll...

Страница 126: ...ferenced in the error message This is so it can speak concisely about threads without repeatedly printing their creation point call stacks Each thread is only ever announced once the first time it appears in any Helgrind error message The main error message begins at the text Possible data race during read At the start is information you would expect to see address and size of the racing access wh...

Страница 127: ...rengths Helgrind will be less effective when you merely throw an existing threaded program at it and try to make sense of any reported errors It will be more effective if you design threaded programs from the start in a way that helps Helgrind verify correctness The same is true for finding memory errors with Memcheck but applies more here because thread checking is a harder problem Consequently i...

Страница 128: ... describe your primitives to Helgrind You should be able to mark up mutexes condition variables etc without difficulty It is also possible to mark up the effects of thread safe reference counting using the ANNOTATE_HAPPENS_BEFORE ANNOTATE_HAPPENS_AFTER and ANNOTATE_HAPPENS_BEFORE_FORGET_ALL macros Thread safe reference counting using an atomically incremented decremented refcount variable causes H...

Страница 129: ... can t see dependencies between the threads if the signaller arrives first In the latter case POSIX guidelines imply that the associated boolean condition still provides an inter thread synchronisation event but one which is invisible to Helgrind The result of Helgrind missing some inter thread synchronisation events is to cause it to report false positives The root cause of this synchronisation l...

Страница 130: ... C destructor sequences at program termination So ideally you should make your application Helgrind clean before using Memcheck Since this circularity is obviously unresolvable at least bear in mind that Memcheck and Helgrind are to some extent complementary and you may need to use them together 7 POSIX requires that implementations of standard I O printf fprintf fwrite fread etc are thread safe U...

Страница 131: ... faster than history level full history level approx provides a compromise between these two extremes It causes Helgrind to show a full trace for the later access and approximate information regarding the earlier access This approx imate information consists of two stacks and the earlier access is guaranteed to have occurred somewhere be tween program points denoted by the two stacks This is not a...

Страница 132: ...helgrind h for further documentation 7 8 A To Do List for Helgrind The following is a list of loose ends which should be tidied up some time For lock order errors print the complete lock cycle rather than only doing for size 2 cycles as at present The conflicting access mechanism sometimes mysteriously fails to show the conflicting access stack even when provided with unbounded storage for conflic...

Страница 133: ...passing paradigm are MPI and CORBA Automatic parallelization A compiler converts a sequential program into a multithreaded program The original program may or may not contain parallelization hints One example of such parallelization hints is the OpenMP standard In this standard a set of directives are defined which tell a compiler how to parallelize a C C or Fortran program OpenMP is well suited f...

Страница 134: ...oblems can occur Data races One or more threads access the same memory location without sufficient locking Most but not all data races are programming errors and are the cause of subtle and hard to find bugs Lock contention One thread blocks the progress of one or more other threads by holding a lock too long Improper use of the POSIX threads API Most implementations of the POSIX threads API have ...

Страница 135: ...y accesses in such applications and although such applications do not make use mutexes most of these applications do not contain data races There exist two different approaches for verifying the correctness of multithreaded programs at runtime The approach of the so called Eraser algorithm is to verify whether all shared memory accesses follow a consistent locking strategy And the happens before d...

Страница 136: ...abling segment merging may improve the accuracy of the so called other segments displayed in race reports but can also trigger an out of memory error segment merging interval n default 10 Perform segment merging only after the specified number of new segments have been created This is an advanced configuration option that allows to choose whether to minimize DRD s memory usage by choosing a low va...

Страница 137: ... no default no Trace all reader writer lock activity trace semaphore yes no default no Trace all semaphore activity 8 2 2 Detected Errors Data Races DRD prints a message every time it detects a data race Please keep the following in mind when interpreting DRD s output Every thread is assigned a thread ID by the DRD tool A thread ID is a number Thread ID s start at one and are never recycled The te...

Страница 138: ...rocess ID of the process being analyzed by DRD The first line Thread 3 tells you the thread ID for the thread in which context the data race has been detected The next line tells which kind of operation was performed load or store and by which thread On the same line the start address and the number of bytes involved in the conflicting access are also displayed Next the call stack of the conflicti...

Страница 139: ...le valgrind tool drd exclusive threshold 10 drd tests hold_lock i 500 10668 Acquired at 10668 at 0x4C267C8 pthread_mutex_lock drd_pthread_intercepts c 395 10668 by 0x400D92 main hold_lock c 51 10668 Lock on mutex 0x7fefffd50 was held during 503 ms threshold 10 ms 10668 at 0x4C26ADA pthread_mutex_unlock drd_pthread_intercepts c 441 10668 by 0x400DB5 main hold_lock c 55 The hold_lock test program ho...

Страница 140: ...n or pthread_cancel 8 2 5 Client Requests Just as for other Valgrind tools it is possible to let a client program interact with the DRD tool through client requests In addition to the client requests several macros have been defined that allow to use the client requests in a convenient way The interface between client programs and the DRD tool is defined in the header file valgrind drd h The avail...

Страница 141: ...r the access just before the latest ANNOTATE_HAPPENS_BEFORE addr annotation that references the same variable The purpose of these two macros is to tell DRD about the order of inter thread memory accesses implemented via atomic memory operations See also drd tests annotate_smart_pointer cpp for an example The macro ANNOTATE_RWLOCK_CREATE rwlock tells DRD that the object at address rwlock is a read...

Страница 142: ... document why data races on var are benign Note this macro can only be used in C programs and not in C programs The macro ANNOTATE_IGNORE_READS_BEGIN tells DRD to ignore all memory loads performed by the current thread The macro ANNOTATE_IGNORE_READS_END tells DRD to stop ignoring the memory loads performed by the current thread The macro ANNOTATE_IGNORE_WRITES_BEGIN tells DRD to ignore all memory...

Страница 143: ...t Thread Library Documentation Boost website 2007 Anthony Williams What s New in Boost Threads Recent changes to the Boost Thread library Dr Dobbs Magazine October 2008 8 2 8 Debugging OpenMP Programs OpenMP stands for Open Multi Processing The OpenMP standard consists of a set of compiler directives for C C and Fortran programs that allows a compiler to transform a sequential program into a paral...

Страница 144: ...16 Location 0x7fefffbc4 is 0 bytes inside local var k declared at omp_matinv c 160 in frame 0 of thread 1 In the above output the function name gj omp_fn 0 has been generated by GCC from the function name gj The allocation context information shows that the data race has been caused by modifying the variable k Note for GCC versions before 4 4 0 no allocation context information is shown With these...

Страница 145: ...ever that some of the Memcheck reports are caused by data races In this case it makes sense to run DRD before Memcheck So which tool should be run first In case both DRD and Memcheck complain about a program a possible approach is to run both tools alternatingly and to fix as many errors as possible after each run of each tool until none of the two tools prints any more error messages 8 2 11 Resou...

Страница 146: ... by different threads get mixed up 2 Create one instance of std ostream for each thread This makes stream formatting settings thread local Pass a per thread instance of the class derived from std ostreambuf to the constructor of each instance 3 Let each thread send its output to its own instance of std ostream instead of std cout 8 3 Using the POSIX Threads API Effectively 8 3 1 Mutex types The Si...

Страница 147: ...happens by passing the sum of clock_gettime CLOCK_REALTIME and a relative timeout as the third argument This approach is incorrect since forward or backward clock adjustments by e g ntpd will affect the timeout A more reliable approach is as follows When initializing a condition variable through pthread_cond_init specify that the timeout of pthread_cond_timedwait will use the clock CLOCK_MONOTONIC...

Страница 148: ...ckers such as Memcheck s That s because the memory isn t ever actually lost a pointer remains to it but it s not in use Programs that have leaks like this can unnecessarily increase the amount of memory they are using over time Massif can help identify these leaks Importantly Massif tells you not only how much heap memory your program is using it also gives very detailed information that indicates...

Страница 149: ...formation about the program prog type valgrind tool massif prog The program will execute slowly Upon completion no summary statistics are printed to Valgrind s commentary all of Massif s profiling data is written to a file By default this file is called massif out pid where pid is the process ID although this filename can be changed with the massif out file option 9 2 3 Running ms_print To see the...

Страница 150: ...ults is deliberate it separates the data gathering from its presentation and means that new methods of presenting the data can be added in the future 9 2 4 The Output Preamble After running this program under Massif the first part of ms_print s output contains a preamble which just states how the program Massif and ms_print were each invoked Command example Massif arguments none ms_print arguments...

Страница 151: ...ample most of the executed instructions involve the loading and dynamic linking of the program The execution of main and thus the heap allocations only occur at the very end For a short running program like this we can use the time unit B option to specify that we want the time unit to instead be the number of bytes allocated deallocated on the heap and stack s If we re run the program under Massi...

Страница 152: ... the max snapshots option half of them are deleted This means that a reasonable number of snapshots are always maintained Most snapshots are normal and only basic information is recorded for them Normal snapshots are represented in the graph by bars consisting of characters Some snapshots are detailed Information about where allocations happened are recorded for these snapshots as we will see shor...

Страница 153: ...1 of the size of the true peak This inaccuracy in the peak measurement can be changed with the peak inaccuracy option The following graph is from an execution of Konqueror the KDE web browser It shows what graphs for larger programs look like MB 3 952 0 Mi 0 626 4 Number of snapshots 63 Detailed snapshots 3 4 10 11 15 16 29 33 34 36 39 41 42 43 44 49 50 51 53 55 56 57 peak Note that the larger siz...

Страница 154: ...ytes allocated in excess of what the program asked for There are two sources of extra heap bytes First every heap block has administrative bytes associated with it The exact number of administrative bytes depends on the details of the allocator By default Massif assumes 8 bytes per block as can be seen from the example but this number can be changed via the heap admin option Second allocators ofte...

Страница 155: ...main example c 20 39 79 8 000B 0x80483C2 g example c 5 19 90 4 000B 0x80483E2 f example c 11 19 90 4 000B 0x8048431 main example c 23 19 90 4 000B 0x8048436 main example c 25 09 95 2 000B 0x80483DA f example c 10 09 95 2 000B 0x8048431 main example c 23 The first four snapshots are similar to the previous ones But then the global allocation peak is reached and a detailed snapshot number 14 is take...

Страница 156: ...mally do However Massif does not detect and warn about every such occurrence Fortunately malformed stack traces are rare in practice Returning now to ms_print s output the final part is similar n time B total B useful heap B extra heap B stacks B 15 21 112 19 096 19 000 96 0 16 22 120 18 088 18 000 88 0 17 23 128 17 080 17 000 80 0 18 24 136 16 072 16 000 72 0 19 25 144 15 064 15 000 64 0 20 26 15...

Страница 157: ...esponse to calls to malloc et al Massif directly measures only these higher level malloc et al calls not the lower level system calls Furthermore a client program may use these lower level system calls directly to allocate memory By default Massif does not measure these Nor does it measure the size of code data and BSS segments Therefore the numbers reported by Massif may be significantly smaller ...

Страница 158: ...ative bytes per block to use This should be an estimate of the average since it may vary For example the allocator used by glibc on Linux requires somewhere between 4 to 15 bytes per block depending on various factors That allocator also requires admin space for freed blocks but Massif cannot account for this stacks yes no default no Specifies whether stack profiling should be done This option slo...

Страница 159: ...block will also be ignored even if the realloc call does not occur in an ignored function This avoids the possibility of negative heap sizes if ignored blocks are shrunk with realloc The rules for writing C function names are the same as for alloc fn above threshold m n default 1 0 The significance threshold for heap allocations as a percentage of total memory size Allocation tree entries that acc...

Страница 160: ...sif does not have a massif h file but it does implement two of the core client requests VALGRIND_MALLOCLIKE_BLOCK and VALGRIND_FREELIKE_BLOCK they are described in The Client Request mechanism 9 6 ms_print Command line Options ms_print s options are h help Show the help message version Show the version number threshold m n default 1 0 Same as Massif s threshold option but applied after profiling r...

Страница 161: ...ess ratios for allocation points which always allocate blocks only of one size and that size is 4096 bytes or less counts showing how often each byte offset inside the block is accessed Using these statistics it is possible to identify allocation points with the following characteristics potential process lifetime leaks blocks allocated by the point just accumulate and are freed only at the end of...

Страница 162: ...n total containing 1 904 700 bytes in total By looking at the max live data we see that not many blocks were simultaneously live though at the peak there were 63 490 allocated bytes in 984 blocks This tells us that the program is steadily freeing such blocks as it runs rather than hanging on to all of them until the end and freeing them all The deaths entry tells us that 29 520 blocks allocated by...

Страница 163: ... 808 blocks tot alloc 1 481 940 in 24 240 blocks avg size 61 13 deaths 24 240 at avg age 34 611 026 acc ratios 2 13 rd 0 91 wr 3 166 650 b read 1 358 820 b written at 0x4C275B8 malloc vg_replace_malloc c 236 by 0x40350E tcc_malloc tinycc c 6712 by 0x404580 tok_alloc_new tinycc c 7151 by 0x4046C4 tok_alloc tinycc c 7190 The acc ratios field tells us that each byte in the blocks allocated here is re...

Страница 164: ...from We see this immediately from the zero read access ratio They do get freed though max live 54 in 3 blocks tot alloc 1 620 in 90 blocks avg size 18 00 deaths 90 at avg age 34 558 236 acc ratios 0 00 rd 1 11 wr 0 b read 1 800 b written at 0x4C275B8 malloc vg_replace_malloc c 236 by 0x40350E tcc_malloc tinycc c 6712 by 0x4035BD tcc_strdup tinycc c 6750 by 0x41FEBB tcc_add_sysinclude_path tinycc c...

Страница 165: ... of the numbers reveals useful information Groups of N consecutive identical numbers that begin at an N aligned offset for N being 2 4 or 8 are likely to indicate an N byte object in the structure at that point For example the first 32 bytes of this object are likely to have the layout 0 64 bit type 8 32 bit type 12 32 bit alignment hole 16 64 bit type 24 64 bit type As a counterexample it s also ...

Страница 166: ...ve maximum live bytes default tot bytes allocd total allocation turnover max blocks live maximum live blocks This controls the order in which allocation points are displayed You can choose to look at allocation points with the highest maximum liveness or the highest total turnover or by the highest number of live blocks These give usefully different pictures of program behaviour For example sortin...

Страница 167: ... to always access that same array To see how this might be useful consider the following buggy fragment int i a 10 both are auto vars for i 0 i 10 i a i 42 At run time we will know the precise address of a on the stack and so we can observe that the first store resulting from a i 42 writes a and we will correctly assume that that instruction is intended always to access a Then on the 11th iteratio...

Страница 168: ...pon which the checking algorithm depends For example int a 10 b 10 p i for i 0 i 10 i p arbitrary condition a i b i p 42 In this case the store sometimes accesses a and sometimes b but in no cases is the addressed array overrun Nevertheless the change in target will cause an error to be reported It is hard to see how to get around this problem The only mitigating factor is that such constructions ...

Страница 169: ...D64 is believed to work properly even in the presence of longjmps within the same stack although this has not been tested However code which switches stacks is likely to cause breakage chaos 11 6 Still To Do User visible Functionality Extend system call checking to work on stack and global arrays Print a warning if a shared object does not have debug info attached or if for whatever reason debug i...

Страница 170: ...imPoint this can be reduced significantly usually by 90 95 while still retaining reasonable accuracy A more complete introduction to how SimPoint works can be found in the paper Automatically Characterizing Large Scale Program Behavior by T Sherwood E Perelman G Hamerly and B Calder 12 2 Using Basic Block Vectors to create SimPoints To quickly create a basic block vector file you will call Valgrin...

Страница 171: ...sed value Other sizes can be used smaller intervals can help programs with finer grained phases However smaller interval size can lead to accuracy issues due to warm up effects When fast forwarding the various architectural features will be un initialized and it will take some number of instructions before they warm up to the state a full simulation would be at without the fast forwarding Large in...

Страница 172: ... is updated If the total instruction count overflows the interval size then we walk the ordered set writing out the statistics for any block that was accessed in the interval then resetting the block counters to zero On the x86 and amd64 architectures the counting code has extra code to handle rep prefixed string instructions This is because actual hardware counts a rep prefixed instruction as one...

Страница 173: ...curacy by V M Weaver and S A McKee 12 8 Performance Using this program slows down execution by roughly a factor of 40 over native execution This varies depending on the machine used and the benchmark being run On the SPEC CPU 2000 benchmarks running on a 3 4GHz Pentium D processor the slowdown ranges from 24x mcf to 340x vortex 2 161 ...

Страница 174: ... etc instructions and IR statements executed IR is Valgrind s RISC like intermediate representation via which all instrumentation is done 5 Ratios between some of these counts 6 The exit code of the client program detailed counts no yes default no When enabled Lackey prints a table containing counts of loads stores and ALU operations differentiated by their IR types The IR types are identified by ...

Страница 175: ...l It performs no instrumentation or analysis of a program just runs it normally It is mainly of use for Valgrind s developers for debugging and regression testing Nonetheless you can run programs with Nulgrind They will run roughly 5 times more slowly than normal for no useful effect Note that you need to use the option tool none to run Nulgrind ie not tool nulgrind 163 ...

Страница 176: ...Valgrind FAQ Release 3 8 0 10 August 2012 Copyright 2000 2012 Valgrind Developers Email valgrind valgrind org ...

Страница 177: ...Valgrind FAQ Table of Contents Valgrind Frequently Asked Questions 1 ii ...

Страница 178: ... 4 4 3 The stack traces given by Memcheck or another tool seem to have the wrong function name in them What s happening 6 4 4 My program crashes normally but doesn t under Valgrind or vice versa What s happening 6 4 5 Memcheck doesn t report any errors and I know my program has errors 6 4 6 Why doesn t Memcheck find the array overruns in this program 7 5 Miscellaneous 7 5 1 I tried writing a suppr...

Страница 179: ...he far regions of the nine worlds Only those judged worthy by the guardians are allowed to pass through Valgrind All others are refused entrance It s not short for value grinder although that s not a bad guess 2 Compiling installing and configuring 2 1 When building Valgrind make dies partway with an assertion failure something like this make expand c 489 allocated_variable_append Assertion curren...

Страница 180: ...ees in your program the above may happen Reason is that your program may trash Valgrind s low level memory manager which then dies with the above assertion or something similar The cure is to fix your program so that it doesn t do any illegal memory accesses The above failure will hopefully go away after that 3 3 My program dies printing a message like this along the way vex x86 IR unhandled instr...

Страница 181: ...a feature Many implementations of the C standard libraries use their own memory pool allocators Memory for quite a number of destructed objects is not immediately freed and given back to the OS but kept in the pool s for later re use The fact that the pools are not freed at the exit of the program cause Valgrind to report this memory as still reachable The behaviour not to free pools at the exit c...

Страница 182: ...can make stack traces worse Some example sub traces With debug information and unstripped best Invalid write of size 1 at 0x80483BF really malloc1 c 20 by 0x8048370 main malloc1 c 9 With no debug information unstripped Invalid write of size 1 at 0x80483BF really in auto homes njn25 grind head5 a out by 0x8048370 main in auto homes njn25 grind head5 a out With no debug information stripped Invalid ...

Страница 183: ...accesses memory that is unaddressable it s possible that this memory will not be unaddressable when run under Valgrind Alternatively if your program has data races these may not manifest under Valgrind There isn t anything you can do to change this it s just the nature of the way Valgrind works that it cannot exactly replicate a native execution environment In the case where your program crashes d...

Страница 184: ...ry However the experimental tool SGcheck can detect errors like this Run Valgrind with the tool exp sgcheck option to try it but be aware that it is not as robust as Memcheck 5 Miscellaneous 5 1 I tried writing a suppression but it didn t work Can you write my suppression for me Yes Use the gen suppressions yes feature to spit out suppressions automatically for you You can then edit them if you li...

Страница 185: ...s editing compiling and re running your program multiple times which is a pain but still easier than debugging the problem without Memcheck s help As for eager reporting of copies of uninitialised memory values this has been suggested multiple times Unfortunately almost all programs legitimately copy uninitialised memory values around because compilers pad structs to preserve alignment and eager c...

Страница 186: ...Valgrind Technical Documentation Release 3 8 0 10 August 2012 Copyright 2000 2012 Valgrind Developers Email valgrind valgrind org ...

Страница 187: ...ation 4 2 3 Advanced Topics 5 2 3 1 Debugging Tips 5 2 3 2 Suppressions 5 2 3 3 Documentation 6 2 3 4 Regression Tests 7 2 3 5 Profiling 7 2 3 6 Other Makefile Hackery 7 2 3 7 The Core tool Interface 7 2 4 Final Words 7 3 Callgrind Format Specification 9 3 1 Overview 9 3 1 1 Basic Structure 9 3 1 2 Simple Example 9 3 1 3 Associations 10 3 1 4 Extended Example 10 3 1 5 Name Compression 11 3 1 6 Sub...

Страница 188: ...res it to other alternative approaches Using Valgrind to detect undefined value errors with bit precision Julian Seward and Nicholas Nethercote Proceedings of the USENIX 05 Annual Technical Conference Anaheim California USA April 2005 How to Shadow Every Byte of Memory Used by a Program Nicholas Nethercote and Julian Seward Pro ceedings of the Third International ACM SIGPLAN SIGOPS Conference on V...

Страница 189: ...tions for instrumenting programs that are called by Valgrind s core They are then linked against Valgrind s core to define a complete Valgrind tool which will be used when the tool option is used to select it 2 2 2 Getting the code To write your own tool you ll need the Valgrind source code You ll need a check out of the Subversion repository for the automake autoconf build instructions to work Se...

Страница 190: ...nd tool foobar date almost any program should work date is just an example The output should be something like this 738 foobar 0 0 1 a foobarring tool 738 Copyright C 2002 2009 and GNU GPL d by J Programmer 738 Using Valgrind 3 5 0 SVN and LibVEX rerun with h for copyright info 738 Command date 738 Tue Nov 27 12 40 49 EST 2007 738 The tool does nothing except run the program uninstrumented These s...

Страница 191: ...dling from scratch because the core is doing most of the work Third the tool can indicate which events in core it wants to be notified about using the functions VG_ track_ These include things such as heap blocks being allocated the stack pointer changing a mutex being locked etc If a tool wants to know about this it should provide a pointer to a function which will be called when that event happe...

Страница 192: ...nternals Much of it isn t that relevant to tool writers however 2 3 Advanced Topics Once a tool becomes more complicated there are some extra things you may want need to do 2 3 1 Debugging Tips Writing and debugging tools is not trivial Here are some suggestions for solving common problems If you are getting segmentation faults in C functions used by your tool the usual GDB command gdb prog core u...

Страница 193: ... the documentation There are some helpful bits and pieces on using XML markup in docs xml xml_help txt 4 Include it in the User Manual by adding the relevant entry to docs xml manual xml Copy and edit an existing entry 5 Include it in the man page by adding the relevant entry to docs xml valgrind manpage xml Copy and edit an existing entry 6 Validate foobar docs fb manual xml using the following c...

Страница 194: ... of profiling tools have trouble running Valgrind For example trying to use gprof is hopeless Probably the best way to profile a tool is with OProfile on Linux You can also use Cachegrind on it Read README_DEVELOPERS for details on running Valgrind under Valgrind it s a bit fragile but can usually be made to work 2 3 6 Other Makefile Hackery If you add any directories under foobar you will need to...

Страница 195: ...Writing a New Valgrind Tool 2 4 Final Words Writing a new Valgrind tool is not easy but the tools you can write with Valgrind are among the most powerful programming tools there are Happy programming 8 ...

Страница 196: ...i e a line number of some source file In addition the second part of the file contains position specifications of the form spec name spec can be e g fn for a function name or fl for a file name Cost lines are always related to the function file specifications given directly before 3 1 2 Simple Example The event names in the following example are quite arbitrary and are not related to event names u...

Страница 197: ...hese look similar to position specifications but consist of 2 lines For calls the format looks like calls Call Count Destination position Source position Inclusive cost of call The destination only specifies subpositions like line number Therefore to be able to specify a call to another function in another source file you have to precede the above lines with a cfn specification for the name of the...

Страница 198: ... term position corresponds to a file name source or object file or function name To support name compression a position specification can be not only of the format spec name but also spec ID name to specify a mapping of an integer ID to a name and spec ID to reference a previously defined ID mapping There is a separate ID mapping for each position specification i e you can use ID 1 for both a file...

Страница 199: ...e is allowed to specify relative addresses This relative specification is not only allowed for instruction addresses but also for line numbers both addresses and line numbers are called subpositions A relative subposition always is based on the corresponding subposition of the last cost line and starts with a to specify a positive difference a to specify a negative difference or consists of to spe...

Страница 200: ...ted Types Event types for cost lines are specified in the events line with an abbreviated name For visualization it makes sense to be able to specify some longer more descriptive name For an event type Ir which means Instruction Fetches this can be specified the header line event Ir Instruction Fetches events Ir Dr In this example Dr itself has no long name associated The order of event lines and ...

Страница 201: ...pr InheritedExpr Name Number Space Space Name InheritedExpr Space Space InheritedExpr LongNameDef NoNewLineChar CostLineDef events Space Name Space Name positions instr Space line BodyLine empty line NoNewLineChar CostLine PositionSpecification AssociationSpecification CostLine SubPositionList Costs SubPositionList SubPosition Space SubPosition Number Number Number Costs Number Space PositionSpeci...

Страница 202: ...ication CallLine n CostLine CallLine calls Space Number Space SubPositionList JumpSpecification Space t Number HexNumber Digit Digit 0 9 HexNumber 0x Digit HexChar HexChar a f A F Name Alpha Digit Alpha Alpha a z A Z NoNewLineChar all characters without n 3 2 2 Description of Header Lines The header has an arbitrary number of lines of the format key value Possible key values for the header are 15 ...

Страница 203: ...ed Type Trigger states the reason of why this trace was generated E g program termination or forced interactive dump positions instr line Callgrind For cost lines this defines the semantic of the first numbers Any combination of instr bb and line is allowed but has to be in this order which corresponds to position numbers at the start of the cost lines later in the file If instr is specified the p...

Страница 204: ...rom this line to the end of the file it makes the number an alias for position Compressed format is always optional Position specifications allowed ob Callgrind The ELF object where the cost of next cost lines happens fl Cachegrind fi Cachegrind fe Cachegrind The source file including the code which is responsible for the cost of next cost lines fi fe is used when the source file changes inside of...

Страница 205: ...t target position Callgrind Unconditional jump executed count times to the given target position jcnd exe count jumpcount target position Callgrind Conditional jump executed exe count times with jumpcount jumps to the given target position 18 ...

Страница 206: ...Valgrind Distribution Documents Release 3 8 0 10 August 2012 Copyright 2000 2012 Valgrind Developers Email valgrind valgrind org ...

Страница 207: ...able of Contents 1 AUTHORS 1 2 NEWS 3 3 OLDER NEWS 36 4 README 74 5 README_MISSING_SYSCALL_OR_IOCTL 76 6 README_DEVELOPERS 80 7 README_PACKAGERS 86 8 README S390 88 9 README android 89 10 README android_emulator 92 11 README mips 94 ii ...

Страница 208: ...ure factoring that forms the basis of the 3 0 line and was also seen in 2 4 0 He also did UCode based dynamic translation support for PowerPC and created a set of ppc linux derivatives of the 2 X release line Greg Parker wrote the Mac OS X port Dirk Mueller contributed the malloc free mismatch checking and other bits and pieces and acts as our KDE liaison Robert Walsh added file descriptor leakage...

Страница 209: ... made a bunch of performance and memory reduction fixes across diverse parts of the system Carl Love and Maynard Johnson contributed IBM Power6 and Power7 support and generally deal with ppc 32 64 linux issues Petar Jovanovic and Dejan Jevtic wrote and maintain the mips32 linux port Dragos Tatulea modified the arm android port so it also works on x86 android Jakub Jelinek helped out with the AVX s...

Страница 210: ...le support for MacOSX 10 8 Support for Intel AVX instructions and for AES instructions This support is available only for 64 bit code Support for POWER Decimal Floating Point instructions TOOL CHANGES Non libc malloc implementations are now supported This is useful for tools that replace malloc Memcheck Massif DRD Helgrind Using the new option soname synonyms such tools can be informed that the ma...

Страница 211: ... 10 7 due to more precise analysis which is important for LLVM Clang generated code This is at the cost of somewhat reduced performance Note there is no change to analysis precision or costs on Linux targets DRD Added even more facilities that can help finding the cause of a data race namely the command line option ptrace addr and the macro DRD_STOP_TRACING_VAR x More information can be found in t...

Страница 212: ...bugs have been fixed or resolved Note that n i bz stands for not in bugzilla that is a bug that was reported to us but never got a bugzilla entry We encourage you to file bugs in bugzilla https bugs kde org enter_bug cgi product valgrind rather than mailing the developers or mailing lists directly bugs that are not entered into bugzilla tend to get forgotten about or ignored To see details of a gi...

Страница 213: ... mode erroneously closed due to buffer overrun 289823 293754 PCMPxSTRx not implemented for 16 bit characters 289839 s390x Provide support for unicode conversion instructions 289939 monitor cmd leak_check with details about leaked or reachable blocks 290006 memcheck doesn t mark xmm as initialized after pcmpeqw xmm xmm 290655 Add support for AESKEYGENASSIST instruction 290719 valgrind 3 7 0 fails w...

Страница 214: ...R Processor decimal floating point instruction support missing 297701 Another alias for strncasecmp_l in libc 2 13 so 297911 invalid write not reported when using APIs for custom mem allocators 297976 s390x revisit EX implementation 297991 Valgrind interferes with mmap ftell 297992 Support systems missing WIFCONTINUED e g pre 2 6 10 Linux 297993 Fix compilation of valgrind with gcc g3 298080 POWER...

Страница 215: ... results under valgrind callgrind 304054 CALL_FN_xx macros need to enforce stack alignment 304561 tee system call not supported 715750 MacOSX Incorrect invalid address errors near 0xFFFFxxxx mozbug n i bz Add missing gdbserver xml files for shadow registers for ppc32 n i bz Bypass gcc4 4 4 5 code gen bugs causing out of memory or asserts n i bz Fix assert in gdbserver for watchpoints watching the ...

Страница 216: ...development but is not available in this release Support for AIX5 has been removed TOOL CHANGES Memcheck some incremental changes reduction of memory use in some circumstances improved handling of freed memory which in some circumstances can cause detection of use after free that would previously have been missed fix of a longstanding bug that could cause false negatives missed errors in programs ...

Страница 217: ...ables or memory from within GDB when running Memcheck arbitrarily large memory watchpoints are supported etc To use the GDB server start Valgrind with the flag vgdb error 0 and follow the on screen instructions Improved support for unfriendly self modifying code a new option smc check all non file is available This adds the relevant consistency checks only to code that originates in non file backe...

Страница 218: ...ault on Mac OS 10 6 267383 Assertion vgPlain_strlen dir vgPlain_strlen file 1 256 failed 267413 Assertion DRD_ g_threadinfo tid synchr_nesting 1 failed 267488 regtest darwin support for 64 bit build 267552 SIGSEGV misaligned_stack_error with DRD but not with other tools 267630 Add support for IBM Power ISA 2 06 stage 1 267769 267997 Darwin memcheck triggers segmentation fault 267819 Add client req...

Страница 219: ...lse positive 272067 s390x fix DISP20 macro 272615 A typo in debug output in mc_leakcheck c 272661 callgrind_annotate chokes when run from paths containing regex chars 272893 amd64 IR 0x66 0xF 0x38 0x2B 0xC1 0x66 0xF 0x7F closed as dup 272955 Unhandled syscall error for pwrite64 on ppc64 arch 272967 make documentation build system more robust 272986 Fix gcc 4 6 warnings with valgrind h 273318 amd64...

Страница 220: ...9071 JDK creates PTEST with redundant REX W prefix 279212 gdbsrv add monitor cmd v info scheduler 279378 exp ptrcheck the impossible happened on mkfifo call 279698 memcheck discards valid bits for packuswb 279795 memcheck reports uninitialised values for mincore on amd64 279994 Add support for IBM Power ISA 2 06 stage 3 280083 mempolicy syscall check errors 280290 vex amd64 IR 0x66 0xF 0x38 0x28 0...

Страница 221: ... rather than mailing the developers or mailing lists directly bugs that are not entered into bugzilla tend to get forgotten about or ignored To see details of a given bug visit https bugs kde org show_bug cgi id XXXXXX where XXXXXX is the bug number as listed below 188572 Valgrind on Mac should suppress setenv mem leak 194402 vex amd64 IR 0x48 0xF 0xAE 0x4 proper FX SAVE RSTOR support 210481 vex a...

Страница 222: ...ace profiler n i bz DRD disable free is write due to implementation difficulties 3 6 1 16 February 2011 vex r2103 valgrind r11561 Release 3 6 0 21 October 2010 3 6 0 is a feature release with many significant improvements and the usual collection of bug fixes This release supports X86 Linux AMD64 Linux ARM Linux PPC32 Linux PPC64 Linux X86 Darwin and AMD64 Darwin Support for recent distros and too...

Страница 223: ...needed to run programs on Mac OS X 10 6 on 32 bit targets Support for IBM POWER6 cpus has been improved The Power ISA up to and including version 2 05 is supported TOOL CHANGES Cachegrind has a new processing script cg_diff which finds the difference between two profiles It s very useful for evaluating the performance effects of a change in a program Related to this change the meaning of cg_annota...

Страница 224: ...ide to users a general set of annotations to describe locks semaphores barriers and condition variables Annotations to describe thread safe reference counted heap objects have also been added Memcheck has a new command line option show possibly lost which is enabled by default When disabled the leak detector will not show possibly lost blocks A new experimental heap profiler DHAT Dynamic Heap Anal...

Страница 225: ...but are not fixed in 3 6 0 due to lack of developer time They may get fixed in later releases They are 194402 vex amd64 IR 0x48 0xF 0xAE 0x4 0x24 0x49 FXSAVE64 212419 false positive lock order violated A B vs A 213685 Undefined value propagates past dependency breaking instruction 216837 Incorrect instrumentation of NSOperationQueue on Darwin 237920 valgrind segfault on fork failure 242137 support...

Страница 226: ...ort partial fix 206600 Leak checker fails to upgrade indirect blocks when their parent becomes reachable 210935 port valgrind h not valgrind to win32 so apps run under wine can make client requests 211410 vex amd64 IR 0x15 0xFF 0xFF 0x0 0x0 0x89 within Linux ip stack checksum functions 212335 unhandled instruction bytes 0xF3 0xF 0xBD 0xC0 lzcnt eax eax 213685 Undefined value propagates past depend...

Страница 227: ... full path names in plain text reports 245925 x86 64 red zone handling problem 246258 Valgrind not catching integer underruns new s 246311 reg reg cmpxchg doesn t work on amd64 246549 unhandled syscall unix 277 while testing 32 bit Darwin app 246888 Improve Makefile vex am 247510 OS X 10 6 Memcheck reports unaddressable bytes passed to f chmod_extended 247526 IBM POWER6 ISA 2 05 support is incompl...

Страница 228: ...supports X86 Linux AMD64 Linux PPC32 Linux PPC64 Linux and X86 Darwin Support for recent distros and toolchain components glibc 2 10 gcc 4 5 has been added Here is a short summary of the changes Details are shown further down Support for Mac OS X 10 5 x Improvements and simplifications to Memcheck s leak checker Clarification and simplifications in various aspects of Valgrind s text output XML out...

Страница 229: ... Ptrcheck tool Objective C garbage collection db attach yes If you have Rogue Amoeba s Instant Hijack program installed Valgrind will fail with a SIGTRAP at start up See https bugs kde org show_bug cgi id 193917 for details and a simple work around Usage notes You will likely find dsymutil yes a useful option as error messages may be imprecise without it Mac OS X support is new and therefore will ...

Страница 230: ...ticeable with Memcheck where the leak summary now occurs before the error summary This change was necessary to allow leaks to be counted as proper errors see the description of the leak checker changes above for more details This was also necessary to fix a longstanding bug in which uses of suppressions against leaks were not counted leading to difficulties in maintaining suppression files see htt...

Страница 231: ...means that Valgrind can output text and XML independently The longstanding problem of XML output being corrupted by unexpected un tagged text messages is solved As before the destination for text output is specified using log file log fd or log socket As before XML output for a tool is enabled using xml yes Because there s a new XML output channel the XML output destination is now specified by xml...

Страница 232: ...upport for describing the behaviour of non POSIX synchronisation objects through ThreadSanitizer compatible ANNOTATE_ macros More controllable tradeoffs between performance and the level of detail of previous accesses in a race There are now three settings history level full This is the default and was also the default in 3 4 x It shows both stacks involved in a race but requires a lot of memory a...

Страница 233: ...time libgomp included with gcc versions 4 3 0 and 4 4 0 Faster operation Added two new command line options first race only and segment merging interval Genuinely atomic support for x86 amd64 ppc atomic instructions Valgrind will now preserve memory access atomicity of LOCK prefixed x86 amd64 instructions and any others implying a global bus lock Ditto for PowerPC l w d arx st w d cx instructions ...

Страница 234: ...rawn by Massif s ms_print program have changed slightly The half height chars and are no longer drawn because they are confusing The y option can be used if the default y resolution is not high enough Horizontal lines are now drawn after the top of a snapshot if there is a gap until the next snapshot This makes it clear that the memory usage has not dropped to zero between snapshots Something that...

Страница 235: ...d suppression supp files were installed Now only default supp is installed This should not affect users as the other installed suppression files were not read the fact that they were installed was a mistake KNOWN LIMITATIONS Memcheck is unusable with the Intel compiler suite version 11 1 when it generates code for SSE2 and above capable targets This is because of icc s use of highly optimised inli...

Страница 236: ...DEVFS_REAPURB 148441 wine can t find memory leak in Wine win32 binary executable file 148742 Leak check fails assert on exit 149878 add proper check for calloc integer overflow 150606 Call graph is broken when using callgrind control 152393 leak errors produce an exit code of 0 I need some way to cause leak errors to result in a nonzero exit code 157154 documentation leak resolution doc speaks abo...

Страница 237: ...algrind fails to build because of duplicate non local asm labels 189737 vex amd64 IR unhandled instruction bytes 0xAC 189762 epoll_create syscall not handled tool exp ptrcheck 189763 drd assertion failure s_threadinfo tid is_recording 190219 unhandled syscall 328 x86 linux 190391 dup of 181394 see above 190429 Valgrind reports lots of errors in ld so with x86_64 2 9 90 glibc 190820 No debug inform...

Страница 238: ...201169 Document read var info 201323 Pre 3 5 0 performance sanity checking 201384 Review user manual for the 3 5 0 release 201585 mfpvr not implemented on ppc 201708 tests failing because x86 direction flag is left set 201757 Valgrind doesn t handle any recent sys_futex additions 204377 64 bit valgrind can not start a shell script with path to shell if the shell is a 32 bit executable n i bz drd f...

Страница 239: ...d syscall getresuid 3 4 1 RC1 24 Feb 2008 vex r1884 valgrind r9253 3 4 1 28 Feb 2008 vex r1884 valgrind r9293 Release 3 4 0 2 January 2009 3 4 0 is a feature release with many significant improvements and the usual collection of bug fixes This release supports X86 Linux AMD64 Linux PPC32 Linux and PPC64 Linux Support for recent distros using gcc 4 4 glibc 2 8 and 2 9 has been added 3 4 0 brings so...

Страница 240: ...al major threading libraries Boost Thread Qt4 glib OpenMP has been added Support for atomic instructions POSIX semaphores barriers and reader writer locks has been added Works now on PowerPC CPUs too Added support for printing thread stack usage at thread exit time Added support for debugging lock contention Added a manual for Drd A new experimental tool exp Ptrcheck has been added Ptrcheck checks...

Страница 241: ...Valgrind on an x86 amd64 linux host so that it runs on a ppc32 64 linux target You can set the main thread s stack size at startup using the new main stacksize flag subject of course to ulimit settings This is useful for running apps that need a lot of stack space The limitation that you can t use trace children yes together with db attach yes has been removed The following bugs have been fixed No...

Страница 242: ...lue not expanded correctly for core file 175044 Add lookup_dcookie for amd64 175150 x86 IR 0xF2 0xF 0x11 0xC1 movss non binutils encoding Developer visible changes Valgrind s debug info reading machinery has been majorly overhauled It can now correctly establish the addresses for ELF data symbols which is something that has never worked properly before now Also Valgrind can now read DWARF3 type an...

Страница 243: ...6 23 1 n i bz support sys_sync_file_range n i bz handle sys_sysinfo sys_getresuid sys_getresgid on ppc64 linux n i bz intercept memcpy in 64 bit ld so s n i bz Fix wrappers for sys_ futimesat utimensat n i bz Minor false error avoidance fixes for Memcheck n i bz libmpiwrap c add a wrapper for MPI_Waitany n i bz helgrind support for glibc 2 8 n i bz partial fix for mc_leakcheck c 698 assert lc_shad...

Страница 244: ...PThreads API detection of potential deadlocks resulting from cyclic lock dependencies and detection of data races Compared to the 2 2 0 Helgrind the race detection algorithm has some significant improvements aimed at reducing the false error rate Handling of various kinds of corner cases has been improved Efforts have been made to make the error messages easier to understand Extensive documentatio...

Страница 245: ...The documentation has been modestly reorganised with the aim of making it easier to find information on common usage scenarios Some advanced material has been moved into a new chapter in the main manual so as to unclutter the main flow and other tidying up has been done There is experimental support for AIX 5 3 both 32 bit and 64 bit processes You need to be running a 64 bit kernel to use Valgrind...

Страница 246: ...e definedness and addressability of these areas is unchanged only the contents are affected The behaviour of Memcheck s client requests VALGRIND_GET_VBITS and VALGRIND_SET_VBITS have changed slightly They no longer issue addressability errors if either array is partially unaddressable they just return 3 as before Also SET_VBITS doesn t report definedness errors if any of the V bits are undefined T...

Страница 247: ...add up 143062 massif crashes on app exit with signal 8 SIGFPE 144453 get_XCon Assertion xpt max_children 0 failed 145559 valgrind aborts when malloc_stats is called 145609 valgrind aborts all runs with repeated section 145622 db attach broken again on x86 64 145837 149519 145887 PPC32 getitimer system call is not supported 146252 150678 146456 update_XCon Assertion xpt curr_space space_delta 14670...

Страница 248: ...he code base has been further factorised and abstractified particularly with respect to support for non Linux OSs 3 3 0 RC1 2 Dec 2007 vex r1803 valgrind r7268 3 3 0 RC2 5 Dec 2007 vex r1804 valgrind r7282 3 3 0 RC3 9 Dec 2007 vex r1804 valgrind r7288 3 3 0 10 Dec 2007 vex r1804 valgrind r7290 Release 3 2 3 29 Jan 2007 Unfortunately 3 2 2 introduced a regression which can cause an assertion failur...

Страница 249: ...ntext hashing fix n i bz fix CFI reading failures Dwarf CFI 0 24 0 32 0 48 0 7 n i bz fix Cachegrind Callgrind simulation bug n i bz libmpiwrap c fix handling of MPI_LONG_DOUBLE n i bz make User errors suppressible 136844 corrupted malloc line when using gen suppressions yes 138507 136844 n i bz Speed up the JIT s register allocator n i bz Fix confusing leak checker flag hints n i bz Support recen...

Страница 250: ...iew of the fact that any 3 3 0 release is unlikely to happen until well into 1Q07 we intend to keep the 3 2 X line alive for a while yet and so we tentatively plan a 3 2 2 release sometime in December 06 The fixed bugs are as follows Note that n i bz stands for not in bugzilla that is a bug that was reported to us but never got a bugzilla entry n i bz Expanding brk into last available page asserts...

Страница 251: ... bugs were not fixed due primarily to lack of developer time and also because bug reporters did not answer requests for feedback in time for the release 129390 ppc IR some kind of VMX prefetch dstt 129968 amd64 IR 0xF 0xAE 0x0 fxsave 133054 make install fails with syntax errors n i bz Signal race condition users list 13 June Johannes Berg n i bz Unrecognised instruction at address 0x70198EC2 users...

Страница 252: ...e it works out of the box on all supported targets The associated KDE KCachegrind GUI remains a separate project A new release of the Valkyrie GUI for Memcheck version 1 2 0 accompanies this release Improvements over previous releases include improved robustness many refinements to the user interface and use of a standard autoconf automake build system You can get it from http www valgrind org dow...

Страница 253: ... segfaults when reading old style stabs debug information have been fixed A simple performance evaluation suite has been added See perf README and README_DEVELOPERS for details There are various bells and whistles New configuration flags enable only32bit enable only64bit By default on 64 bit platforms ppc64 linux amd64 linux the build system will attempt to build a Valgrind which supports both 32 ...

Страница 254: ...it 0 123210 New strlen from ld linux on amd64 123244 DWARF2 CFI reader unhandled CFI instruction 0 18 123248 syscalls in glibc 2 4 openat fstatat symlinkat 123258 socketcall recvmsg msg msg_iov i points to uninit 123535 mremap new_addr requires MREMAP_FIXED in 4th arg 123836 small typo in the doc 124029 ppc compile failed vor gcc 3 3 5 124222 Segfault don t know what type is 124475 ppc32 crash sys...

Страница 255: ...s segfaults while reading debug info 119914 117936 120345 117936 118239 amd64 0xF 0xAE 0x3F clflush 118939 vm86old system call n i bz memcheck tests mempool reads freed memory n i bz AshleyP s custom allocator assertion n i bz Dirk strict aliasing stuff n i bz More space for debugger cmd line Dan Thaler n i bz Clarified leak checker output message n i bz AshleyP s gen suppressions output fix n i b...

Страница 256: ...nd CPUs capable of Altivec too G4 G5 Valgrind s address space management has been overhauled As a result Valgrind should be much more robust with programs that use large amounts of memory There should be many fewer memory exhausted messages and debug symbols should be read correctly on large eg 300MB executables On 32 bit machines the full address space available to user programs usually 3GB or 4G...

Страница 257: ...here If Valgrind itself crashes the OS will create a normal core file The following are some user visible changes that occurred in earlier versions that may not have been announced or were announced but not widely noticed So we re mentioning them now The tool flag is optional once again if you omit it Memcheck is run by default The num callers flag now has a default value of 12 It was previously 4...

Страница 258: ... 104065 113126 115741 113126 113403 Partial SSE3 support on x86 113541 vex Grp5 x86 alt encoding inc dec case 1 113642 valgrind crashes when trying to read debug information 113810 vex x86 IR 66 0F F6 66 PSADBW SSE PSADBW 113796 read and write do not work if buffer is in shared memory 113851 vex x86 IR pmaddwd 0x66 0xF 0xF5 0xC7 114366 vex amd64 cannnot handle __asm__ fninit 114412 vex amd64 IR 0x...

Страница 259: ...e to 3 0 1 is recommended The fixed bugs are note n i bz means not in bugzilla this bug does not have a bugzilla entry 109313 110505 x86 cmpxchg8b n i bz x86 track but ignore changes to eflags AC alignment check 110102 dis_op2_E_G amd64 110202 x86 sys_waitpid 286 110203 clock_getres 0 110208 execve fail wrong retval 110274 SSE1 now mandatory for x86 110388 amd64 0xDD 0xD1 110464 amd64 0xDC 0x1D FC...

Страница 260: ...ind now supports architectures other than x86 The new architectures it supports are AMD64 and PPC32 and the infrastructure is present for other architectures to be added later AMD64 support works well but has some shortcomings It generally won t be as solid as the x86 version For example support for more obscure instructions and system calls may be missing We will fix these as they arise Address s...

Страница 261: ...at allocate many heap blocks may run faster due to improvements in certain data structures Addrcheck is currently not working We hope to get it working again soon Helgrind is still not working as was the case for the 2 4 0 release The JITter has been completely rewritten and is now in a separate library called Vex This enabled a lot of the user visible changes such as new architecture support The ...

Страница 262: ...on failed 109810 vex amd64 IR unhandled instruction bytes 0xA3 0x4C 0x70 0xD7 109802 Add a plausible_stack_size command line parameter 109783 unhandled ioctl TIOCMGET running hw detection tool discover 109780 unhandled ioctl BLKSSZGET running fdisk l dev hda 109718 vex x86 IR unhandled instruction ffreep 109429 AMD64 unhandled syscall 127 sigpending 109401 false positive uninit in strchr from ld l...

Страница 263: ... bug fixes The most significant user visible change is that we no longer supply our own pthread implementation Instead Valgrind is finally capable of running the native thread library either LinuxThreads or NPTL This means our libpthread has gone along with the bugs associated with it Valgrind now supports the kernel s threading syscalls and lets you use your standard system libpthread As a result...

Страница 264: ...the signal returns You will need to run with single step yes to make this useful Valgrind is built in Position Independent Executable PIE format if your toolchain supports it This allows it to take advantage of all the available address space on systems with 4Gbyte user address spaces Valgrind can now run itself requires PIE support Syscall arguments are now checked for validity Previously all mem...

Страница 265: ...096 unhandled ioctl 0x4B3A and 0x5601 93117 Tool and core interface versions do not match 93128 Can t run valgrind tool memcheck because of unimplement 93174 Valgrind can crash if passed bad args to certain syscalls 93309 Stack frame in new thread is badly aligned 93328 Wrong types used with sys_sigprocmask 93763 usr include asm msr h is missing 93776 valgrind vg_memory c 508 vgPlain_find_map_spac...

Страница 266: ...reating threads in a forked process fails 101313 valgrind causes different behavior when resizing a window 101423 segfault for c array of floats 101562 valgrind massif dies on SIGINT even with signal handler r Stable release 2 2 0 31 August 2004 CHANGES RELATIVE TO 2 0 0 2 2 0 brings nine months worth of improvements and bug fixes We believe it to be a worthy successor to 2 0 0 There are literally...

Страница 267: ...en fixed since 2 1 2 85658 Assert in coregrind vg_libpthread c 2326 open64 void 0 failed This bug was reported multiple times and so the following duplicates of it are also fixed 87620 85796 85935 86065 86919 86988 87917 88156 80716 Semaphore mapping bug caused by unmap sem_destroy Was fixed prior to 2 1 2 86987 semctl and shmctl syscalls family is not handled properly 86696 valgrind 2 1 2 RH AS2 ...

Страница 268: ...causing memcheck to sometimes give nonsense results on SSE code Add support for the POSIX message queue system calls Fix to allow 32 bit Valgrind to run on AMD64 boxes Note this does NOT allow Valgrind to work with 64 bit executables only with 32 bit executables on an AMD64 box At configure time only check whether linux mii h can be processed so that we don t generate ugly warnings by trying to co...

Страница 269: ... Support crash due to initialisation ordering probs also 85118 80942 Addrcheck wasn t doing overlap checking as it should 78048 return NULL on malloc new etc failure instead of asserting 73655 operator new override in user so files often doesn t get picked up 83060 Valgrind does not handle native kernel AIO 69872 Create proper coredumps after fatal signals 82026 failure with new glibc versions __l...

Страница 270: ...Add support for syscalls set_tid_address 258 acct 51 Support instruction repne movs not official but seems to occur Implement an emulated soft limit for file descriptors in addition to the current reserved area which effectively acts as a hard limit The setrlimit system call now simply updates the emulated limits as best as possible the hard limit is not allowed to move at all and just returns EPE...

Страница 271: ...ere 69616 glibc 2 3 2 w NPTL is massively different than what valgrind expects 69856 I don t know how to instrument MMXish stuff Helgrind 73892 valgrind segfaults starting with Objective C debug info fix for S type stabs 73145 Valgrind complains too much about close reserved fd 73902 Shadow memory allocation seems to fail on RedHat 8 0 68633 VG_N_SEMAPHORES too low V itself was leaking semaphores ...

Страница 272: ...y to day basis 2 1 0 is known to build and pass regression tests on SuSE 9 SuSE 8 2 RedHat 8 2 1 0 most notably includes Jeremy Fitzhardinge s complete overhaul of handling of system calls and signals and their interaction with threads In general the accuracy of the system call thread and signal simulations is much improved Specifically Blocking system calls behave exactly as they do when running ...

Страница 273: ...pport for SuSE 9 and the Red Hat Severn beta Further improvements to SSE SSE2 support The entire test suite of the GNU Scientific Library gsl 1 4 compiled with Intel Icc 7 1 20030307Z g O xW now works I think this gives pretty good coverage of SSE SSE2 floating point instructions or at least the subset emitted by Icc Also added support for the following instructions MOVNTDQ UCOMISD UNPCKLPS UNPCKH...

Страница 274: ...hold of a copy of 9 A detailed list of changes in no particular order Describe gen suppressions in the FAQ Syscall __NR_waitpid supported Minor MMX bug fix v prints program s argv at startup More glibc 2 3 suppressions Suppressions for stack underrun bug s in the c support library distributed with Intel Icc 7 0 Fix problems reading proc self maps Fix a couple of messages that should have been supp...

Страница 275: ...ith Addrcheck as well as Memcheck Fix this Memcheck the impossible happened get_error_name unexpected type Install headers needed to compile new skins Remove leading spaces and colon in the LD_LIBRARY_PATH LD_PRELOAD passed to non traced children Fix file descriptor leak in valgrind listener Fix longstanding bug in which the allocation point of a block resized by realloc was not correctly set This...

Страница 276: ...d app if ever I saw one Automatic generation of suppression records you no longer need to write them by hand Use gen suppressions yes strcpy memcpy etc check their arguments for overlaps when running with the Memcheck or Addrcheck skins malloc_usable_size is now supported new client requests VALGRIND_COUNT_ERRORS VALGRIND_COUNT_LEAKS useful with regression testing VALGRIND_NON_SIMD_CALL 0123 for r...

Страница 277: ...get this 84 tests 2 stderr failures 1 stdout failure corecheck tests res_search stdout memcheck tests sigaltstack stderr sigaltstack is probably harmless res_search doesn t work on R H 8 even running natively so I m not too worried On Red Hat 7 3 a glibc 2 2 5 system I get these harmless failures 84 tests 2 stderr failures 1 stdout failure corecheck tests pth_atfork1 stdout corecheck tests pth_atf...

Страница 278: ...f the checks made is unchanged Support for kernels 2 5 68 Dummy implementations of __libc_current_sigrtmin __libc_current_sigrtmax and __libc_allocate_rtsig hopefully good enough to keep alive programs which previously died for lack of them Fix bug in the VALGRIND_DISCARD_TRANSLATIONS client request Fix bug in the DWARF2 debug line info loader when instructions following each other have source lin...

Страница 279: ... Minor changes in 1 9 5 Added some errors to valgrind h to ensure people don t include it accidentally in their sources This is a change from 1 0 X which was never properly documented The right thing to include is now memcheck h Some people reported problems and strange behaviour when incorrectly including valgrind h in code with 1 9 1 1 9 4 This is no longer possible Add some __extension__ bits a...

Страница 280: ...building the cvs head from SourceForge or getting a snapshot of it Current cool stuff going in includes MMX support done SSE SSE2 support in progress a significant 10 20 performance improvement done and the usual large collection of minor changes Hopefully we will be able to improve our NPTL support but no promises 73 ...

Страница 281: ... detector two thread error detectors a cache and branch prediction profiler a call graph generating cache abd branch prediction profiler and a heap profiler It also includes three experimental tools a heap stack global array overrun detector a different kind of heap profiler and a SimPoint basic block vector generator Valgrind is closely tied to details of the CPU operating system and to a lesser ...

Страница 282: ...environment you need the standard autoconf tools to do so 3 Continue with the following instructions To install from a tar bz2 distribution 4 Run configure with some options if you wish The only interesting one is the usual prefix where you want it installed 5 Run make 6 Run make install possibly as root if the destination permissions require that 7 See if it works Try valgrind ls l Either this wo...

Страница 283: ...l happens for example a request to read part of a file control passes to the Linux kernel which fulfills the request and returns control to your program The problem is that the kernel will often change the status of some part of your program s memory as a result and tools instrumentation plug ins may need to know about this Syscall and ioctl wrappers have two jobs 1 Tell a tool what s about to hap...

Страница 284: ...ool that the buffer is about to be written to if ARG1 0 PRE_MEM_WRITE time ARG1 sizeof vki_time_t Finally the really important bit after the syscall occurs in the POST function if and only if the system call was successful tell the tool that the memory was written if ARG1 0 POST_MEM_WRITE ARG1 sizeof vki_time_t The POST function won t be called if the syscall failed so you don t need to worry abou...

Страница 285: ...the syscall do one of PRE_MEM_READ PRE_MEM_RASCIIZ PRE_MEM_WRITE for that parameter Then do the syscall Then if the syscall succeeds issue suitable POST_MEM_WRITE calls There s no need for POST_MEM_READ calls Also add it to the syscall_table array use one of GENX_ GENXY LINX_ LINXY PLAX_ PLAXY GEN for generic syscalls in syswrap generic c LIN for linux specific ones in syswrap linux c and PLA for ...

Страница 286: ...eck failure for the syscall wrapper you just made if this is the case 4 Once happy send us the patch Pretty please Writing your own ioctl wrappers Is pretty much the same as writing syscall wrappers except that all the action happens within PRE ioctl and POST ioctl There s a default case sometimes it isn t correct and you have to write a more specific case to get the right behaviour As above pleas...

Страница 287: ... linking and packaging everything up the command will also build the documentation Even if all required tools for building the documentation are installed this step may not succeed because of hidden dependencies E g on Ubuntu you must have docbook xsl installed Additionally specific tool versions maybe needed If you only want to test whether the generated tarball is complete and runs regression te...

Страница 288: ... trunk2 do this to compare them on all the performance tests perl perf vg_perf vg trunk1 vg trunk2 perf Debugging Valgrind with GDB To debug the valgrind launcher program prefix bin valgrind just run it under gdb in the normal way Debugging the main body of the valgrind code and or the code for a particular tool requires a bit more trickery but can be achieved without too much problem by following...

Страница 289: ...ere pid you read from the output printed by 1 This attaches GDB to the tool executable which should be in the abovementioned wait loop 3 Do cont to continue After the loop finishes spinning startup will continue as normal Note that comment 3 above re passing signals applies here too Self hosting This section explains A How to configure Valgrind to run under Valgrind Such a setup is called self hos...

Страница 290: ...using and slow but it does work well enough for you to get some useful performance data Inner has most of its output ie those lines beginning with pid prefixed with a which helps a lot However when running regression tests in an Outer Inner setup this prefix causes the reg test diff to fail Give sim hints no inner prefix to the Inner to disable the production of the prefix in the stdout stderr out...

Страница 291: ...llgrind do perl perf vg_perf outer valgrind outer bin valgrind outer tool callgrind perf To compare the performance of multiple Valgrind versions do perl perf vg_perf outer valgrind outer bin valgrind vg inner_xxxx vg inner_yyyy perf where inner_xxxx and inner_yyyy are the versions to compare Cachegrind and cg_diff are particularly handy to obtain a delta between the two versions When the outer to...

Страница 292: ... a particular block that causes a crash do the following Try running with vex guest chase thresh 0 trace flags 10000000 trace notbelow 999999 This should print one line for each block translated and that includes the address Then re run with 999999 changed to the highest bb number shown This will print the one line per block and also will print a disassembly of the block in which the fault occurre...

Страница 293: ...ppc64 linux Memcheck will simply stop at startup and print an error message if such symbols are not present because it is infeasible to continue It s not like this is going to cost you much space We only need the symbols for ld so a few K at most Not the debug info and not any debuginfo or extra symbols for any other libraries Unfortunate but true When you configure to build with the prefix foo ba...

Страница 294: ...LENode const klaola cc 416 by 0x4C21788F OLEFilter convert QCString const olefilter cc 272 This isn t so helpful Although you can tell there is a mismatch the names of the allocating and deallocating functions are no longer visible The same kind of thing occurs in various other messages from valgrind Don t strip symbols from lib valgrind in the installation tree Doing so will likely cause problems...

Страница 295: ...ware combinations exp sgcheck cachegrind and callgrind are currently not supported Some gcc versions use mvc to copy 4 8 byte values This will affect some debug messages Valgrind will complain about 4 or 8 one byte reads writes instead of just 1 read write Recommendations Applications should be compiled with fno builtin to avoid false positives due to builtin string operations when running memchec...

Страница 296: ...e http code google com p android issues detail id 23203 For the android emulator the versions needed and how to install them are described in README android_emulator Install it somewhere Doesn t matter where Then do this Modify this obviously Note this export command is only done so as to reduce the amount of typing required None of the commands below read it as part of their operation export NDKR...

Страница 297: ... with the prefix in the configure command below even if you think it s wrong You may need to set the with tmpdir path to something different if sdcard doesn t work on the device this is a known cause of difficulties autogen sh for ARM CPPFLAGS sysroot NDKROOT platforms android 3 arch arm DANDROID_HARDWARE_ HWKIND CFLAGS sysroot NDKROOT platforms android 3 arch arm configure prefix data local Inst ...

Страница 298: ...d the usual args etc Once you re up and running a handy modify V rebuild reinstall command line on the host of course is mq j2 mq j2 install DESTDIR pwd Inst adb push Inst where mq is an alias for make quiet One common cause of runs failing at startup is the inability of Valgrind to find a suitable temporary directory On the device there doesn t seem to be any one location which we always have per...

Страница 299: ...dk 7u4 linux i586 tar gz install sdk tar xzf android sdk_r18 linux tgz install ndk tar xjf android ndk r8 linux x86 tar bz2 setup PATH to use the installed software export SDKROOT HOME android android sdk linux export PATH PATH SDKROOT tools SDKROOT platform tools export NDKROOT HOME android android ndk r8 install android platforms you want by starting android from SDKROOT tools select the platfor...

Страница 300: ... or two time out from adb shell before it works adb shell Once the emulator is ready push your Valgrind to the emulator adb push Inst if you need to debug You have on the android side a gdbserver on the device side gdbserver 1234 your_exe on the host side adb forward tcp 1234 tcp 1234 HOME android android ndk r8 toolchains arm linux androideabi 4 4 3 prebuilt linux x86 bin arm linux androideabi gd...

Страница 301: ...have to be in PATH with pagesize option is used to set default PAGE SIZE If option is not used PAGE SIZE is set to value default for platform on which Valgrind is built on Possible values are 4 16 of 64 and represent size in kilobytes host mips linux gnu is necessary if you compile it with cross toolchain compiler for big endian platform host mipsel linux gnu is necessary if you compile it with cr...

Страница 302: ...README mips based on newer GCC versions if possible 95 ...

Страница 303: ...GNU Licenses ...

Страница 304: ...GNU Licenses Table of Contents 1 The GNU General Public License 1 2 The GNU Free Documentation License 8 ii ...

Страница 305: ...receive source code or can get it if you want it that you can change the software or use pieces of it in new free programs and that you know you can do these things To protect your rights we need to make restrictions that forbid anyone to deny you these rights or to ask you to surrender the rights These restrictions translate to certain responsibilities for you if you distribute copies of the soft...

Страница 306: ...is covered only if its contents constitute a work based on the Program independent of having been made by running the Program Whether that is true depends on what the Program does 1 You may copy and distribute verbatim copies of the Program s source code as you receive it in any medium provided that you conspicuously and appropriately publish on each copy an appropriate copyright notice and discla...

Страница 307: ...rogram In addition mere aggregation of another work not based on the Program with the Program or with a work based on the Program on a volume of a storage or distribution medium does not bring the other work under the scope of this License 3 You may copy and distribute the Program or a work based on it under Section 2 in object code or executable form under the terms of Sections 1 and 2 above prov...

Страница 308: ...buting the Program or any work based on the Program you indicate your acceptance of this License to do so and all its terms and conditions for copying distributing or modifying the Program or works based on it 6 Each time you redistribute the Program or any work based on the Program the recipient automatically receives a license from the original licensor to copy distribute or modify the Program s...

Страница 309: ... Such new versions will be similar in spirit to the present version but may differ in detail to address new problems or concerns Each version is given a distinguishing version number If the Program specifies a version number of this License which applies to it and any later version you have the option of following the terms and conditions either of that version or of any later version published by...

Страница 310: ...e to most effectively convey the exclusion of warranty and each file should have at least the copyright line and a pointer to where the full notice is found one line to give the program s name and a brief idea of what it does Copyright C year name of author This program is free software you can redistribute it and or modify it under the terms of the GNU General Public License as published by the F...

Страница 311: ...ht disclaimer for the program if necessary Here is a sample alter the names Yoyodyne Inc hereby disclaims all copyright interest in the program Gnomovision which makes passes at compilers written by James Hacker signature of Ty Coon 1 April 1989 Ty Coon President of Vice This General Public License does not permit incorporating your program into proprietary programs If your program is a subroutine...

Страница 312: ...free software We have designed this License in order to use it for manuals for free software because free software needs free documentation a free program should come with manuals providing the same freedoms that the software does But this License is not limited to software manuals it can be used for any textual work regardless of subject matter or whether it is published as a printed book We reco...

Страница 313: ...s a machine readable copy represented in a format whose specification is available to the general public that is suitable for revising the document straightforwardly with generic text editors or for images composed of pixels generic paint programs or for drawings some widely available drawing editor and that is suitable for input to text formatters or for automatic translation to a variety of form...

Страница 314: ...ou add no other conditions whatsoever to those of this License You may not use technical measures to obstruct or control the reading or further copying of the copies you make or distribute However you may accept compensation in exchange for copies If you distribute a large enough number of copies you must also follow the conditions in section 3 You may also lend copies under the same conditions st...

Страница 315: ...hese things in the Modified Version A Use in the Title Page and on the covers if any a title distinct from that of the Document and from those of previous versions which should if there were any be listed in the History section of the Document You may use the same title as a previous version if the original publisher of that version gives permission B List on the Title Page as authors one or more ...

Страница 316: ...alify as Secondary Sections and contain no material copied from the Document you may at your option designate some or all of these sections as invariant To do this add their titles to the list of Invariant Sections in the Modified Version s license notice These titles must be distinct from any other section titles You may add a section Entitled Endorsements provided it contains nothing but endorse...

Страница 317: ... individual copies of this License in the various documents with a single copy that is included in the collection provided that you follow the rules of this License for verbatim copying of each of the documents in all other respects You may extract a single document from such a collection and distribute it individually under this License provided you insert a copy of this License into the extracte...

Страница 318: ...y provided for under this License Any other attempt to copy modify sublicense or distribute the Document is void and will automatically terminate your rights under this License However parties who have received copies or rights from you under this License will not have their licenses terminated so long as such parties remain in full compliance 10 FUTURE REVISIONS OF THIS LICENSE The Free Software ...

Страница 319: ...ed in the section entitled GNU Free Documentation License If you have Invariant Sections Front Cover Texts and Back Cover Texts replace the with Texts line with this with the Invariant Sections being LIST THEIR TITLES with the Front Cover Texts being LIST and with the Back Cover Texts being LIST If you have Invariant Sections without Cover Texts or some other combination of the three merge those t...

Отзывы: