47
Chapter 9: Tools
airFiber AF-24/AF-24HD User Guide
Ubiquiti Networks, Inc.
airView
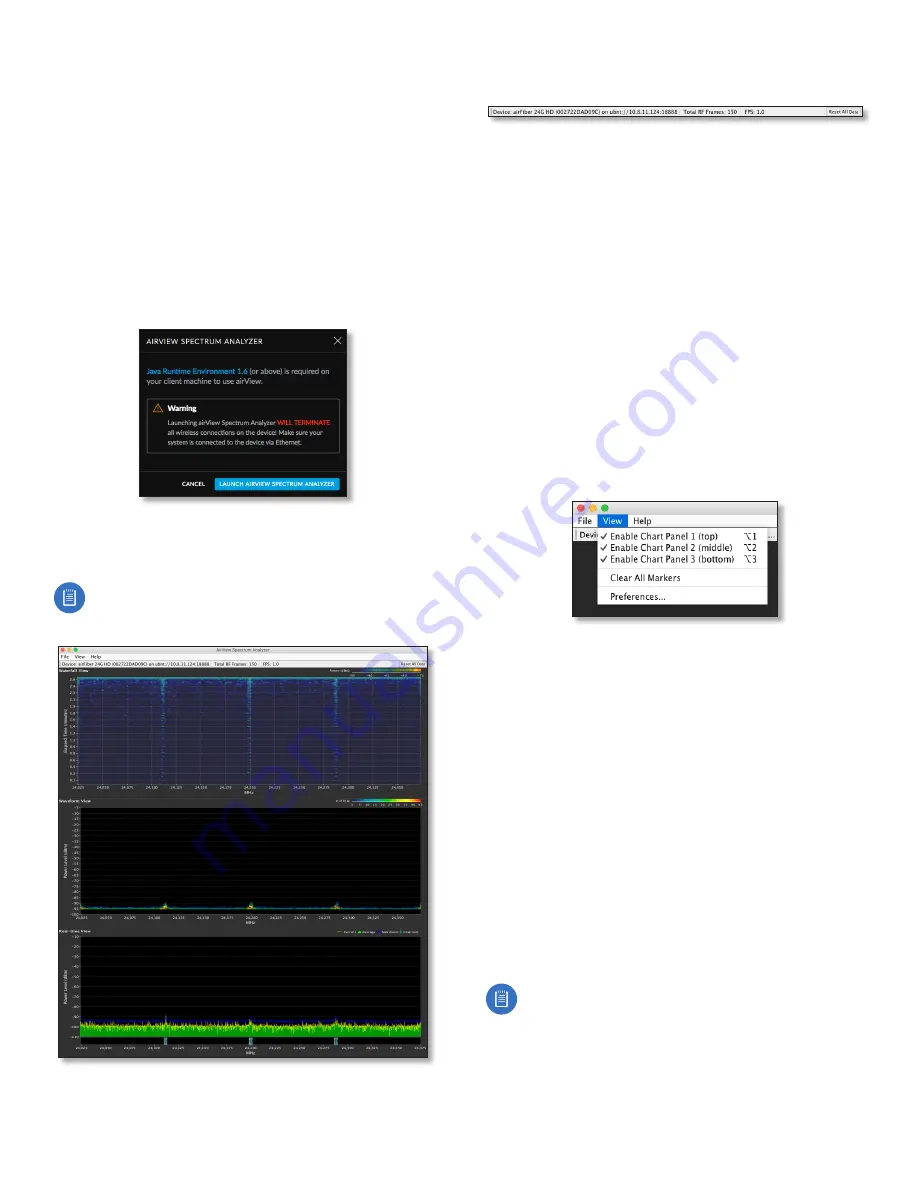
Use the airView Spectrum Analyzer to analyze the noise
environment of the radio spectrum and intelligently select
the optimal frequency to install a PtP airFiber AF-24 link.
There are two system requirements for the airView
Spectrum Analyzer:
• Your system is connected to the device via Ethernet.
Launching airView will terminate all wireless
connections on the device.
•
Java Runtime Environment 1.6 (or above) is required on
your client machine to use airView.
On first use, the following window appears.
•
Launch airView
Click
Launch airView
to download the
Java Network Launch Protocol (jnlp) file and complete
the launch of airView.
Note:
Depending on your browser settings, you
may also see addtional prompts; continue through
these as needed to finish launching airView.
Main View
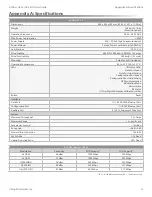
Device
Displays the device name, MAC (Media Access
Control) address, and IP address of the device running
airView.
Total RF Frames
Displays the total number of Radio
Frequency (RF) frames gathered since the start of the
airView session or since the
Reset All Data
button was last
clicked.
FPS
Displays the total number of frames per second (FPS)
gathered since the start of the airView session or since
the
Reset All Data
button was last clicked. The wider the
interval amplitude, the fewer the FPS will be gathered.
Reset All Data
Click to reset all gathered data. Use this
option to analyze the spectrum for another location or
address.
File Menu
Click
Exit
to end the airView session.
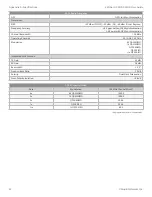
View Menu
Enable Chart Panel 1 (top)
Displays the Waterfall or
Channel Usage chart in Chart Panel 1, depending on
which option you have selected in
Preferences
. This
time-based graph shows the aggregate energy collected
or channel usage for each frequency since the start of the
airView session.
Enable Chart Panel 2 (middle)
Displays the Waveform
chart in Chart Panel 2. This time-based graph shows the RF
signature of the noise environment since the start of the
airView session. The energy color designates its amplitude.
Cooler colors represent lower energy levels (with blue
representing the lowest levels) in that frequency bin, and
warmer colors (yellow, orange, or red) represent higher
energy levels in that frequency bin.
Enable Chart Panel 3 (bottom)
Displays the Real-time
chart (traditional spectrum analyzer) in Chart Panel 3.
Energy (in dBm) is shown in real time as a function of
frequency.
Note:
Energy is defined as the power ratio in
decibels (dB) of the measured power referenced to
one milliwatt (mW).
Содержание airFiber 24
Страница 1: ...24 GHz Point to Point Radio Models AF 24 AF 24HD ...
Страница 2: ......
Страница 24: ...20 Chapter 2 Installation airFiber AF 24 AF 24HD User Guide Ubiquiti Networks Inc ...
Страница 28: ...24 airFiber AF 24 AF 24HD User Guide Ubiquiti Networks Inc ...
Страница 32: ...28 Chapter 4 Dashboard airFiber AF 24 AF 24HD User Guide Ubiquiti Networks Inc ...
Страница 36: ...32 Chapter 5 Wireless Tab airFiber AF 24 AF 24HD User Guide Ubiquiti Networks Inc ...
Страница 40: ...36 airFiber AF 24 AF 24HD User Guide Ubiquiti Networks Inc ...
Страница 44: ...40 Chapter 7 Services Tab airFiber AF 24 AF 24HD User Guide Ubiquiti Networks Inc ...
Страница 48: ...44 Chapter 8 System Tab airFiber AF 24 AF 24HD User Guide Ubiquiti Networks Inc ...
Страница 54: ...50 Chapter 9 Tools airFiber AF 24 AF 24HD User Guide Ubiquiti Networks Inc ...
Страница 60: ...56 Appendix B Safety Notices airFiber AF 24 AF 24HD User Guide Ubiquiti Networks Inc ...
Страница 66: ...62 Appendix E Declaration of Conformity airFiber AF 24 AF 24HD User Guide Ubiquiti Networks Inc ...
Страница 68: ...w w w u b n t c o m ...


