30
Programming with TIDE
©2000-2008 Tibbo Technology Inc.
DIV
0
Division by zero
Yes
No
OO
R
Out of range (attempt to access past the
highest array member)
Yes
No
FPE
RR
Floating point error
Yes
No
IOC
Invalid opcode*
Yes
Yes
OU
M
Access outside of user memory*
Yes
Yes
TDL
F
Failed to load binary library*
Yes
Yes
*This exception indicates that either TiOS or Tibbo Basic compiler is not functioning
properly. Let us know if you encounter this exception!
4.1.8.2
Program Pointer
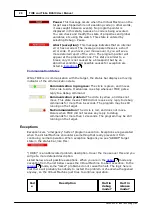
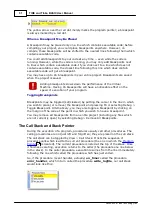
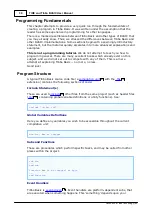
The program pointer is a line, highlighted in yellow, which shows the present
location of program execution. It looks like this:
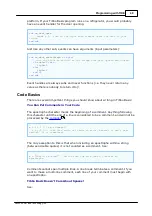
This means that the yellow line is now pending execution. It hasn't been executed
yet. The machine is waiting for you to tell it what to do. You can now control it by
.
This line is displayed whenever the Virtual Machine has been paused while
executing code. This can be achieved by setting a
, or simply
selecting Debug > Pause at the "right" time.
The program pointer will only stop on lines which contain actual executable code.
dim
x
as
byte
' the program pointer won't stop here, as this isn't
executable code.
x =
1
' the program pointer will stop here -- this is an actual
instruction to do something.
4.1.8.3
Breakpoints
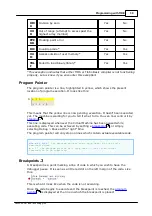
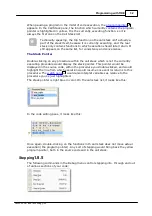
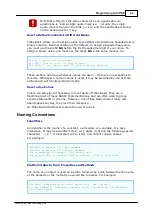
A breakpoint is a point marking a line of code in which you wish to have the
debugger pause. It is seen as a little red dot on the left margin of the code. Like
this:
This is what it looks like when the code is not executing.
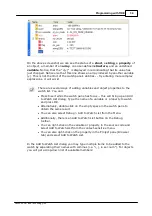
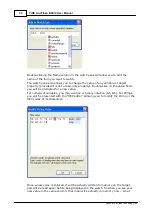
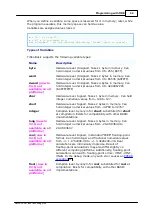
Once the code begins to execute and the breakpoint is reached, the
is displayed at the line in which the breakpoint is placed:
32
30
30


