Operator’s Manual
41
Traces
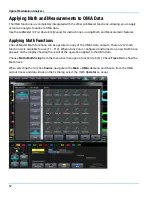
This set of visualizations shows time domain behavior of the input signals. The LabMaster Math
functions allow further processing of the OMA trace data. See Applying Math Functions on p.52.
T
RACE
D
ISPLAY
M
ODE
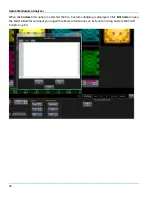
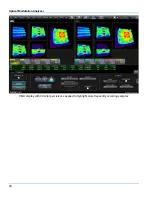
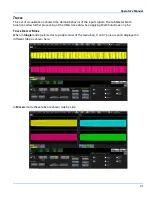
When in Single mode (selected at top-right corner of the menu bar), X and Y pols are each displayed in
different tabs, as shown here:
In Mosaic mode these tabs are shown side by side:
Содержание IQS25
Страница 1: ...Operator s Manual Optical Modulation Analyzer ...
Страница 2: ......
Страница 3: ...Optical Modulation Analyzer Operator s Manual August 2016 ...
Страница 22: ...Optical Modulation Analyzer 14 Optical Configuration Typical dual polarization optical configuration ...
Страница 86: ...Optical Modulation Analyzer 78 ...
Страница 87: ......
Страница 88: ...927295 00 Rev A August 2016 ...


