- 18 -
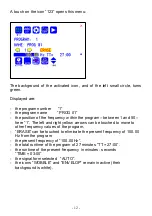
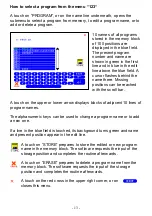
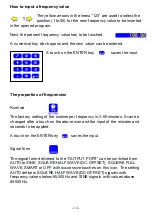
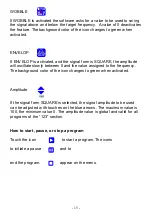
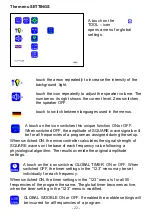
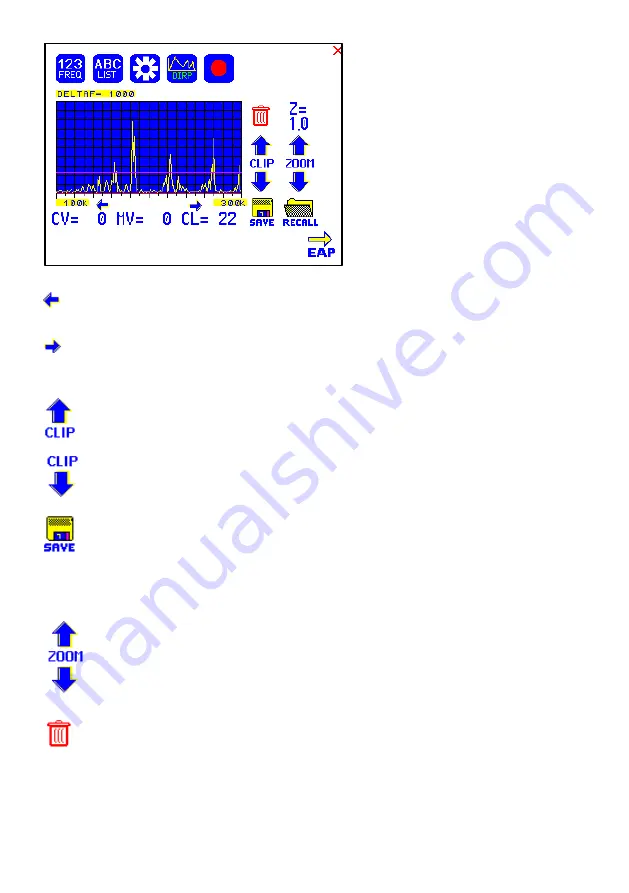
The display on the screen
show s all details of the recalled
analysis, including the settings
for “Fmin”, “Fmax”, “DELTA F”
and the Clipping Level “CL =
22” (the violet line), w here it
separates 10 HITS ( Measured
Values of resonances) from the
remaining graph.
touch to move w ithin the graph in the direction of Fmin
to read the CV, MV and CL of individual resonances.
touch to move w ithin the graph in the direction of Fmax
to read the CV, MV and CL of individual resonances.
touch to move the violet line upw ard, thereby reducing
the number of HITS (MVs) to deal w ith.
touch to move the violet line dow nw ard, thereby
increasing the number of HITS (MVs) to deal w ith.
touch to save the DIRP data set back to the active
program position. All data changed versus the recalled
set overw rites the old data and also overw rites the name
of the application w ith the name “DIRP”. This can be
easily edited in the “123” progra m section.
touch to zoom the graph in steps vertically from 0.0 to
2.0 to improve the reading. The Clipping level w ill be
recalculated to match the moves. Default setting of zoom
is 1.0.
Clear graph.
.
How to prepare for a DIRP and run it
Содержание F-SCAN3 NT
Страница 2: ...2...

